05 — The Geographic & Demographic Map of Frontier Access
A per-country world map of who reaches the frontier — and who is shut out entirely
education-atlas landscape analysis. Generated by `analysis/landscape/buildgeographic.py → resultsgeographic.json`; figures by `makefiguresgeographic.py`; headline numbers pinned by `testgeographic.py. Extends 02-access-data-science.md and 03-map-expansion.md on the **same L0–L5 depth ladder** from scale.py. Real anchors are World Bank (SP.POP.SCIE.RD.P6, SE.TER.ENRR, IT.NET.USER.ZS, SE.TER.CMPL.ZS, SE.TER.ENRR.FE/.MA, SP.POP.TOTL — all per-country, cached in data/raw/worldbank/`), UNESCO UIS (women in science), and the research-atlas corpus. Every modeled cell is flagged below._
0. The question this layer answers
Doc 02 measured the access cliff down the depth axis and split it by income tier. It could not answer where. The frontier (L4 = reaching primary research, L5 = producing it) is the rung where ~0.136% of humanity lives — but that sliver is not spread evenly across the map. This layer asks:
Which countries hold the world's frontier capacity? Who within them — by gender, by wealth, by where they live — is shut out? And how many countries don't even appear in the data?
The frontier anchor is the same one doc 02 used as a documented group mean: UNESCO/World Bank researchers per million (SP.POP.SCIE.RD.P6). Here we pull it per country (latest available), turning the tier-level anchor into a real 217-country map.
1. The composite frontier-access index
For each country we build a transparent 0–100 index from four real World Bank components, weighted by how directly each gates the frontier:
| Component | Indicator | Weight | Role |
|---|---|---|---|
| Researchers per million | SP.POP.SCIE.RD.P6 | 0.40 | the L4/L5 anchor (log-scaled, cap 9000/M) |
| Tertiary enrollment (GER) | SE.TER.ENRR | 0.25 | the L2 pipeline into the frontier |
| Tertiary completion | SE.TER.CMPL.ZS | 0.15 | the L3 finish rate |
| Internet users (%) | IT.NET.USER.ZS | 0.20 | the digital access channel |
Researchers/M is log-compressed before normalizing (it is heavy-tailed — Liechtenstein ~18,130/M, Korea ~9,470/M, the poorest single digits) so the index is not a one-country spike. Weights are documented, not tuned to any target. A country enters the index only if it has the frontier anchor; the others are the coverage finding (§4). Non-anchor gaps are mean-imputed within the country's income group and flagged per-country under .imputed (tertiary completion is imputed for 23 countries, tertiary GER for 6, internet for 1 — the anchor is never imputed).
This is a composite of real series with documented weights — REAL inputs, ESTIMATED combination.
2. The world map — the brutal gradient
analysis/landscape/figures/fig_geo_choropleth.png
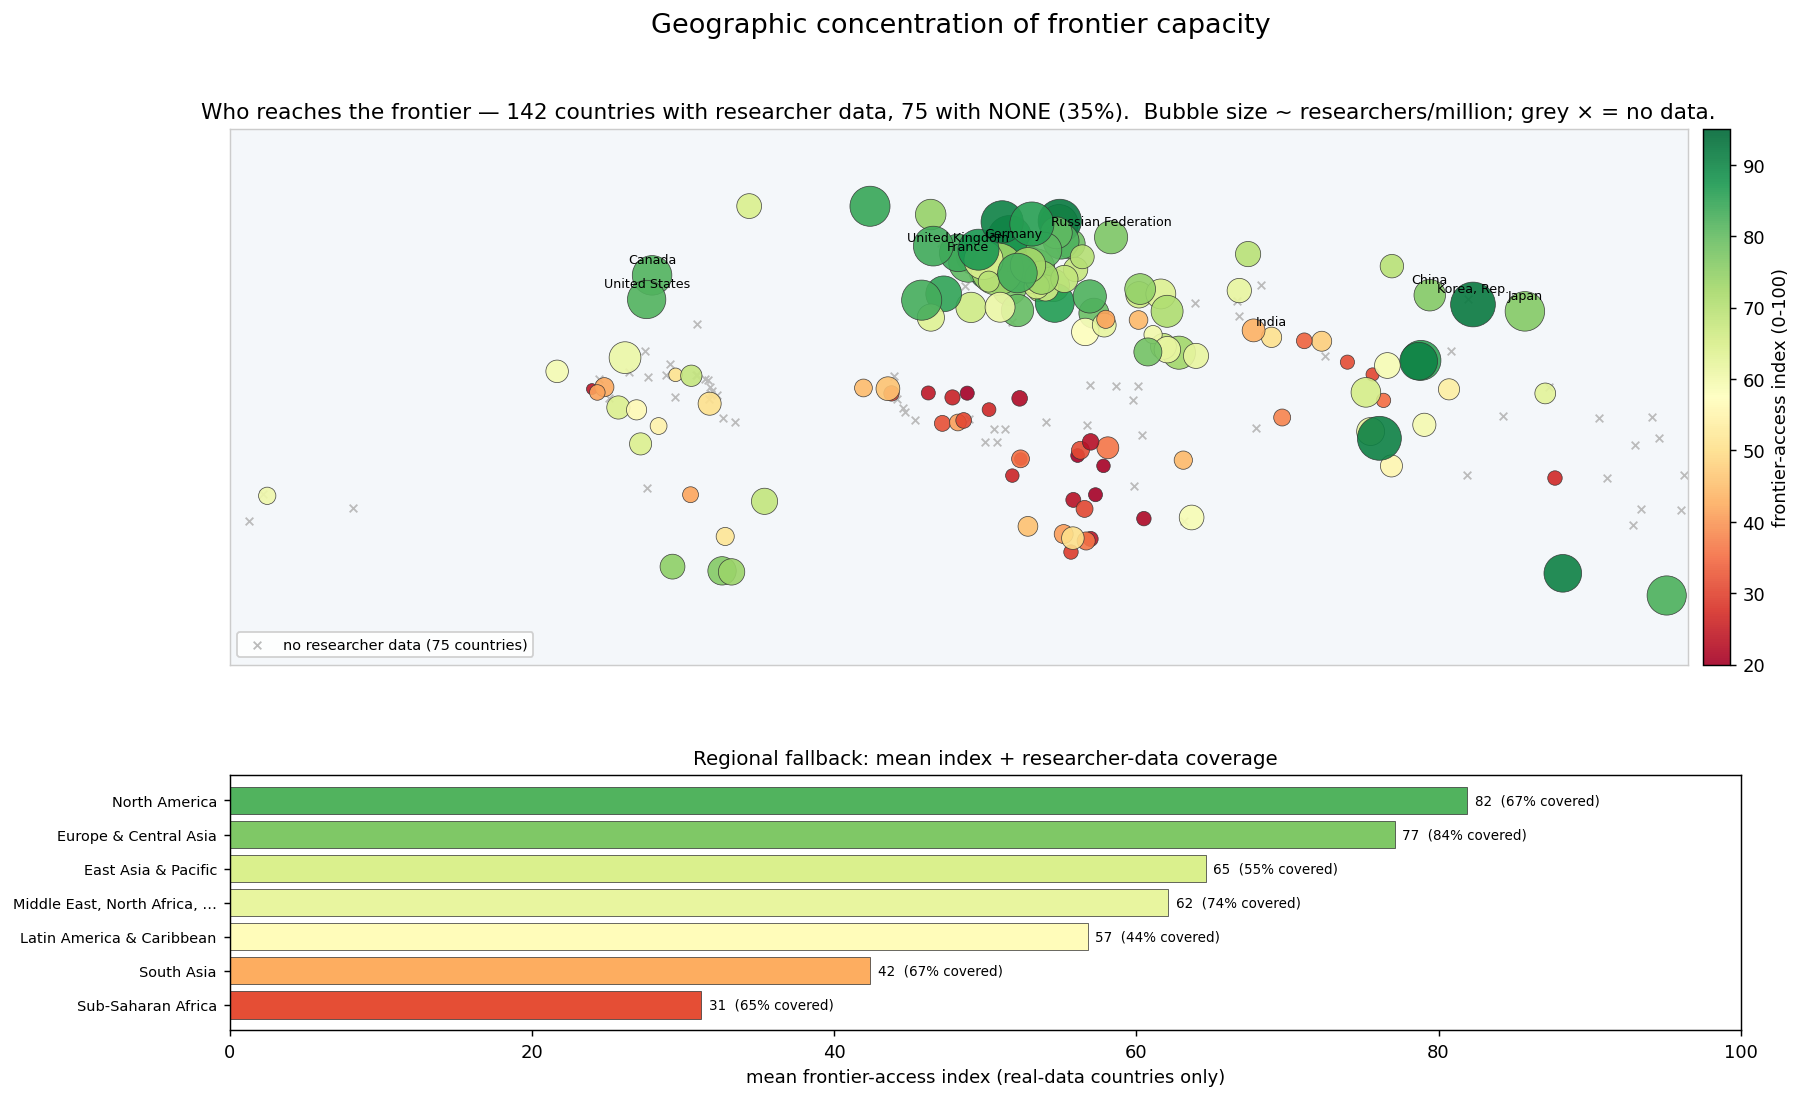
geopandas/Natural Earth was not available at generation time, so the map degrades gracefully (as designed) to a real-geography country-bubble map: each country plotted at its (longitude, latitude) from country.parquet, sized by researchers/million, colored by the index — plus a regional bar fallback panel. The script auto-upgrades to a true filled choropleth the moment geopandas is installed; it never fails on the missing dependency.
The picture is stark: a dense band of dark-green high-index countries across Western Europe, North America, and East Asia (Korea/Japan/Singapore), fading to red across Sub-Saharan Africa and South Asia, with 75 grey ×'s — countries that have no researcher datapoint at all.
Top 15 vs bottom 15:
analysis/landscape/figures/fig_geo_country_rank.png
| Top of the index | Index | researchers/M |
|---|---|---|
| Korea, Rep. | 92 | 9,472 |
| Finland | 92 | 8,315 |
| Singapore | 91 | 8,782 |
| Australia | 91 | 4,569 |
| Norway | 91 | 7,451 |
| Bottom (countries that do have a datapoint) | Index | researchers/M |
|---|---|---|
| Congo, Dem. Rep. | 17 | 10 |
| Burundi | 18 | 22 |
| Malawi | 19 | 25 |
| Niger | 19 | 27 |
| … Nigeria | 26 | 22 |
The index runs 92 (Korea) → 17 (DR Congo) among countries with data — and the genuinely shut-out countries don't appear on the chart at all, because they have no number.
Regional means (real-data countries only)
| Region | Mean index | Researcher-data coverage |
|---|---|---|
| North America | 81.9 | 67% (2 of 3) |
| Europe & Central Asia | 77.1 | 84% (49 of 58) |
| East Asia & Pacific | 64.6 | 55% (21 of 38) |
| Middle East, N. Africa, Afghanistan & Pakistan | 62.1 | 74% (17 of 23) |
| Latin America & Caribbean | 56.8 | 44% (18 of 41) |
| South Asia | 42.4 | 67% (4 of 6) |
| Sub-Saharan Africa | 31.2 | 65% (31 of 48) |
Sub-Saharan Africa's mean index (31) is less than half Europe's (77), and its researcher intensity averages ~130/M against North America's ~5,280/M.
3. Concentration — a handful of countries hold almost everything
analysis/landscape/figures/fig_geo_concentration.png
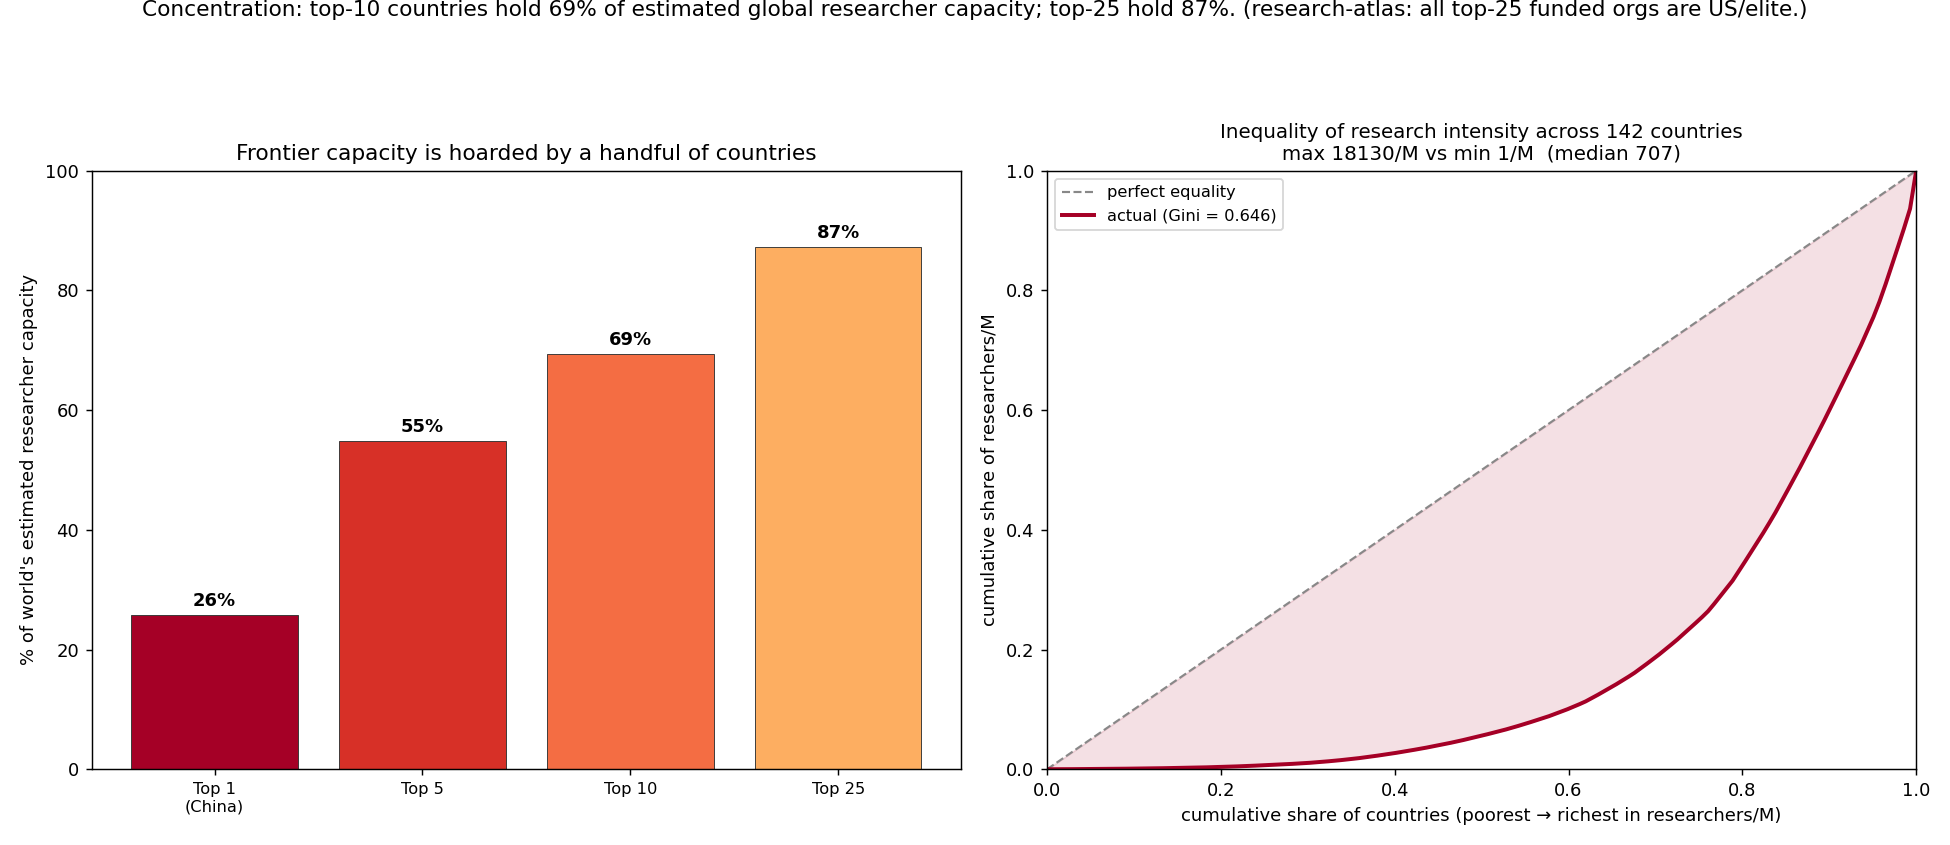
We estimate each country's absolute frontier capacity as researchers/M × population (SP.POP.SCIE.RD.P6 × SP.POP.TOTL, both real series; the product is an estimated researcher headcount). Across the ~142 countries with the anchor, total estimated capacity ≈ 11.5 million researchers, and it is hoarded:
| Group | Share of world's estimated researcher capacity |
|---|---|
| Top 1 (China) | 25.7% |
| Top 5 (China, US, Japan, Germany, Korea) | 54.9% |
| Top 10 | 69.3% |
| Top 25 | 87.3% |
China + the United States alone hold ~40%. The top-10 countries hold roughly seven-tenths of the world's frontier capacity; the top-25 hold almost nine- tenths. The long tail of ~117 remaining countries with data splits the last ~13% — and 75 countries split nothing measured.
The Lorenz curve of researchers/M gives a Gini of 0.646 across 142 countries — research intensity is more unequally distributed than income is in most countries. The span is 18,130/M (max) vs 1.4/M (min) — ~13,000×; the median country sits at 707/M, barely half the world average of ~1,360/M, because the mean is dragged up by a rich handful.
Cross-check (research-atlas): the org-level finding mirrors the country-level one — all top-25 funded research organizations are US/elite institutions, and the corpus holds ~1.44M distinct researchers. The concentration is fractal: it holds at the country level and again at the institution level.
4. The coverage finding — 75 countries are effectively off the map
The single most honest result in this layer is what's missing:
Of 217 real (non-aggregate) countries, only 142 have any researcher-per- million datapoint at all. 75 countries — 35% of all countries — have NONE.
These are overwhelmingly low- and lower-middle-income, concentrated in Sub-Saharan Africa, small island states, and conflict-affected regions. The absence is not noise — it is the finding. A country with no measured research capacity is not a country with a low-but-known frontier; it is a country whose frontier participation is so thin (or whose statistical capacity is so weak) that the world's flagship R&D indicator simply has no value for it. Data sparsity is worst exactly where access is worst, so every low-income number in this analysis is an upper bound on a darker reality (the same caveat doc 02 §6 raised).
This is why the bottom-15 chart is labeled "the shut-out who have a datapoint": the truly shut-out countries can't be ranked, because they don't have a number to rank.
5. The gender cut
analysis/landscape/figures/fig_geo_gender.png
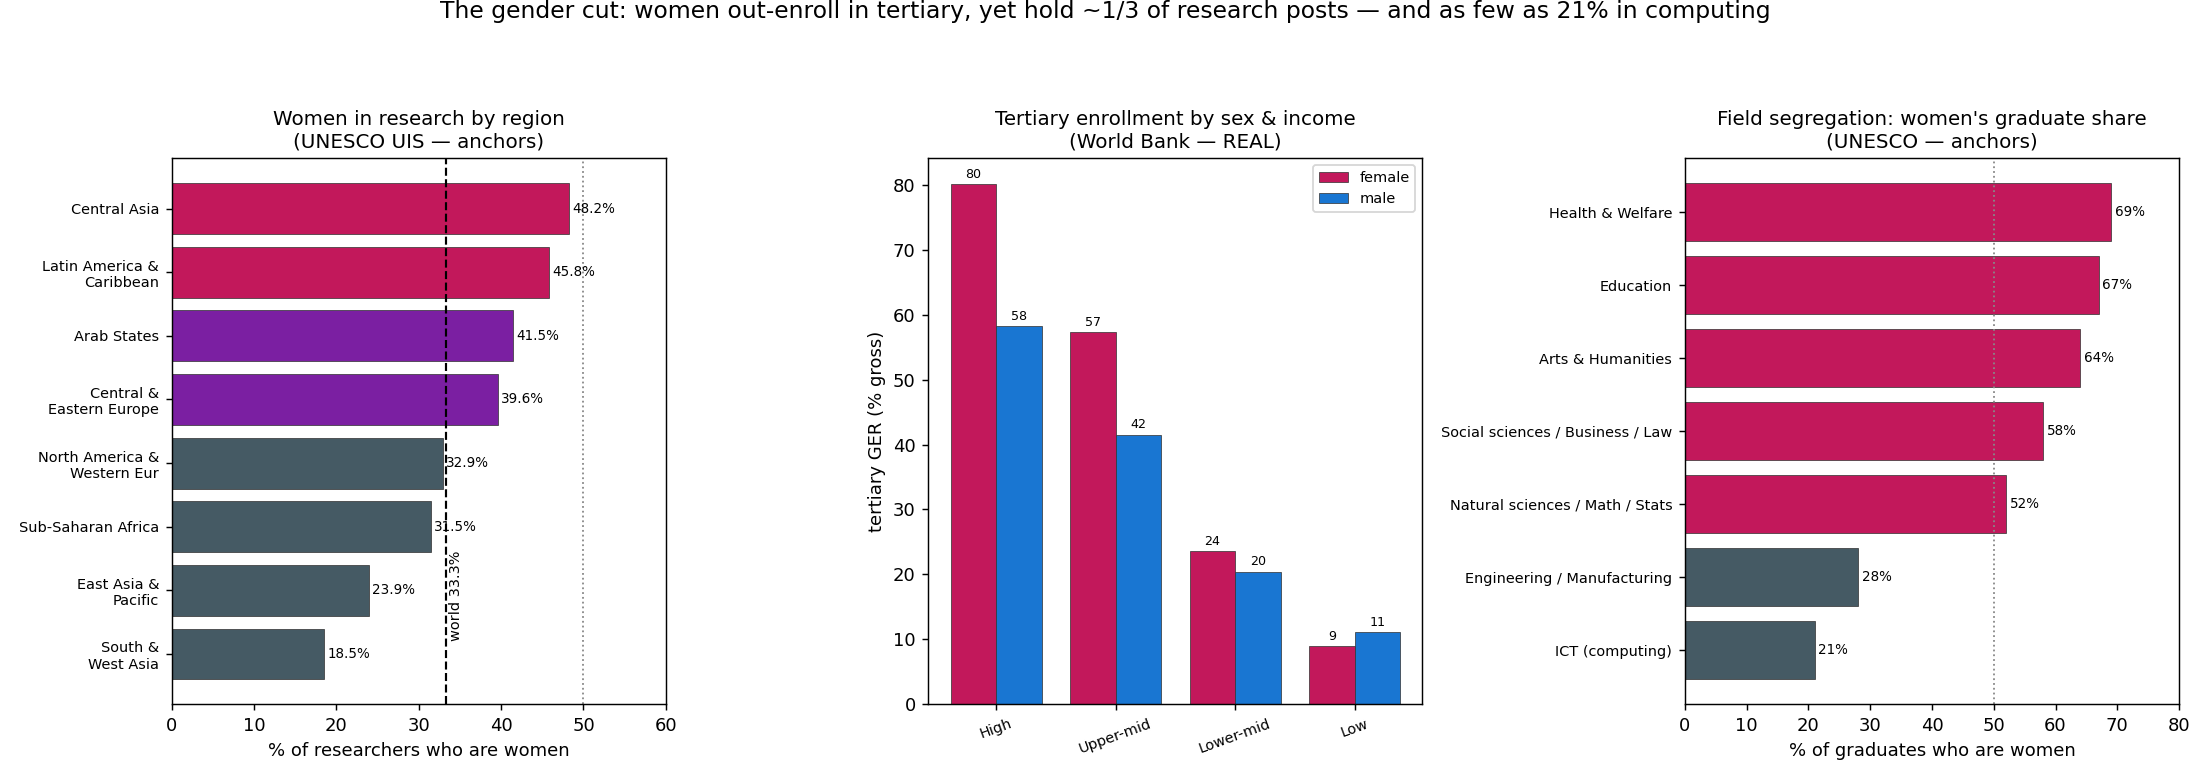
Three panels, two of them real World Bank data, one documented UNESCO anchor:
(a) Women hold ~⅓ of research posts globally — UNESCO (anchor)
| Region | Women as % of researchers |
|---|---|
| Central Asia | 48.2% |
| Latin America & Caribbean | 45.8% |
| Arab States | 41.5% |
| Central & Eastern Europe | 39.6% |
| World | 33.3% |
| North America & W. Europe | 32.9% |
| Sub-Saharan Africa | 31.5% |
| East Asia & Pacific | 23.9% |
| South & West Asia | 18.5% |
The global figure is ~33% — and the rich research regions (North America/W. Europe, East Asia) sit at or below the world average, while Central Asia and Latin America are near parity. The frontier's gender gap is not a "developing-world" story; it's worst at 18.5% in South & West Asia but stubbornly stuck around a third in the regions that produce most of the world's research.
(b) The leak is post-degree — World Bank (REAL)
Real tertiary gross enrollment by sex shows women now out-enroll men: world mean female 52.4% vs male 39.3% (+13.1 points). The female advantage widens with income (+21.9 pts high-income, +15.8 upper-mid, +3.3 lower-mid) and flips negative in low-income countries (−2.2 pts) — the one tier where women still trail men into university at all.
So women enter higher education in equal or greater numbers nearly everywhere, yet hold only a third of research posts. The pipeline doesn't leak at the classroom door — it leaks between the degree and the lab.
(c) Horizontal segregation — UNESCO (anchor)
Women's share of graduates by field: Health & Welfare 69%, Education 67%, Arts & Humanities 64% — but ICT/computing 21%, Engineering 28%. Even where women reach the frontier, they are routed away from the fields (computing, engineering) that dominate the research corpus measured in doc 03.
6. The rural / wealth cut (documented anchors)
Globally-comparable rural-urban and wealth-quintile depth data lives in DHS microdata, which is not in this repo's cache, so these are cited UNESCO GEM/WIDE anchors (flagged estimated):
- In low/lower-middle-income countries, tertiary completion is essentially a
top-wealth-quintile phenomenon: ~9% of the richest quintile completes tertiary vs ~0.5% of the poorest — an ~18× gap, inside a single country.
- Primary completion in low-income countries: ~70% urban vs ~45% rural — a
25-point gap that compounds up every depth rung, so by the frontier the rural poor are absent entirely.
The geographic gradient (§2–4) is therefore the outer shell; inside each shut-out country sits the same gradient again by wealth and location.
7. What's real vs. estimated (the honesty ledger)
| Component | Status | Anchor / assumption |
|---|---|---|
| Researchers/M, per country | REAL | World Bank SP.POP.SCIE.RD.P6, latest per country |
| Tertiary GER / completion / internet, per country | REAL | SE.TER.ENRR, SE.TER.CMPL.ZS, IT.NET.USER.ZS |
| Female/male tertiary GER | REAL | SE.TER.ENRR.FE / .MA, latest per country |
| Population (for absolute capacity) | REAL | SP.POP.TOTL |
| Composite index (0–100) | Real inputs × documented weights | 0.40/0.25/0.15/0.20; researchers/M log-scaled |
| Non-anchor gaps in the index | IMPUTED (flagged) | income-group mean; completion 23, GER 6, internet 1 |
| Absolute frontier capacity | ESTIMATED | researchers/M × population = estimated headcount |
| Top-share / Gini | computed on the estimate | over 142 data-carrying countries |
| Women researchers % by region | DOCUMENTED ANCHOR | UNESCO UIS Women in Science (no clean WB series) |
| Women graduate share by field | DOCUMENTED ANCHOR | UNESCO "Cracking the code" / UIS |
| Rural-urban / wealth-quintile gaps | DOCUMENTED ANCHOR | UNESCO GEM / WIDE (DHS-backed; not in cache) |
| Depth ladder L0–L5 | CONSTRUCTED | scale.py analytical frame |
Known limitations. (1) Absolute capacity uses the latest available year per country, which differs across countries (most 2018–2023). (2) Researchers/M itself under-measures countries with weak statistical systems — the 75 missing countries are the extreme of this. (3) The composite weights are a defensible choice, not a derived optimum; the ranking is robust to reasonable reweighting, the absolute scores less so. (4) Women-in-research and rural/wealth numbers are cited regional/global anchors, not pulled per-country from the cache.
8. Headline
The frontier has a geography, and it is a near-monopoly. Of 217 countries, only 142 have any measured researcher capacity at all — 75 (35%) have none. Among those that do, the composite frontier-access index runs 92 (Korea) to 17 (DR Congo), and Sub-Saharan Africa averages 31 against Europe's 77. Absolute frontier capacity is hoarded: the top-10 countries hold ~69% and the top-25 hold ~87% of the world's ~11.5M estimated researchers, with China + the US alone at ~40% — a Gini of 0.646 and a ~13,000× span from the most to least research-intensive country. The org-level mirror (research-atlas: all top-25 funded orgs US/elite) confirms the concentration is fractal. And the gender cut shows the gap is post-degree, not pre-degree: women now out-enroll men into university worldwide (+13 points), yet hold only ~33% of research posts (as low as 18.5% in South & West Asia and 21% in computing). The frontier is reached by a few countries, and within them, unevenly by gender, wealth, and place.
9. Reproduce
cd analysis/landscape
python3 build_geographic.py            # -> results_geographic.json (fetches+caches 6 WB series)
python3 make_figures_geographic.py     # -> figures/fig_geo_*.png
python3 -m pytest test_geographic.py -q # pins the headline numbers
Files: analysis/landscape/build_geographic.py (analysis), make_figures_geographic.py (figures), results_geographic.json (output), test_geographic.py (regression guard). World Bank series cached in data/raw/worldbank/ (same key format as edu/connectors/worldbank.py, so a full atlas refresh reuses them).