Corpus: education-atlas v1.1 — 78,326 observations / 219 countries / 30 indicators, vs UN SDG 4
The Knowledge-Access Gradient
Who can reach how deep into human knowledge, at what age, at what cost — and what that means for reforming education
education-atlas — the flagship synthesis. v1.1. Gianangelo Dichio · Bucket Foundation · 2026-06-25.
This document consolidates the entire education-atlas corpus — the quantitative problem atlas (`docs/EDUCATION_PROBLEMS.md`), the four structural deep-dives (`docs/deep/01–04`), the four neutral foundations briefs (`docs/foundations/01–04`), the seven landscape briefs (`docs/landscape/01–07`), the reform thesis (`docs/REFORM_THESIS.md`), and the reproducible analyses behind `analysis/landscape/results.json`, `results_expansion.json`, `results_geographic.json`, and `results_historical.json` — into one argument. Version 1.1 adds the three dimensions the corpus gained after v1.0 — the historical access arc across 5,000 years (`docs/landscape/06`), the geographic map of frontier capacity (`docs/landscape/05`), and the modality axis of how knowledge is acquired (`docs/landscape/07`) — woven into the argument as its spine, its cross-section, and its mechanism rather than appended. Every headline number is traceable to one of those sources or to the authoritative custodians they cite (World Bank EdStats, UNESCO UIS, OECD PISA, ITU, OpenAlex/research-atlas, the economic-history literature on print and literacy, and the peer-reviewed learning-science literature). Where a figure is constructed or estimated rather than measured, it is flagged as such — the same evidence discipline the corpus holds throughout.
Abstract
For five thousand years, every knowledge technology widened access to consume knowledge — to read, learn, and reach what others already discovered — and *none widened access to produce it. Writing gave knowledge an external store but gated it to a literate elite; the printing press collapsed the cost of a copy by orders of magnitude (book prices fell ~⅔ in fifty years, output rose ~10⁴ per century) and lit the Reformation and the Scientific Revolution, but amplified who could be read, not who could originate; public libraries and mass schooling carried literacy from ~12% in 1820 to ~88% today — the largest consume-access expansion in history by headcount — while the modern university enclosed production behind a credential; the internet drove the cost of a copy to zero and open access finally extended reading all the way to the research frontier, and still the rate at which humanity produces new knowledge held near ~0.14%. That arc is the organizing finding of this document. The present-day access cliff is the cross-section of it. Measured against UN Sustainable Development Goal 4, today's record shows three stacked crises — a learning crisis (48.3% of 10-year-olds worldwide cannot read a simple text; 86.5% in Sub-Saharan Africa), an access crisis that has shrunk but moved up a level (51M primary-age and 61M lower-secondary-age children out of school), and a financing crisis underwriting both (world education spend is 3.6% of GDP, below the agreed 4% floor, with 92 of ~200 countries beneath it). But the deepest inequity is not visible in the access statistics at all. Laid on a grid of age × depth — basic literacy (L0) up through undergraduate (L2), graduate (L3), reading the frontier (L4), producing new knowledge (L5) — access falls off a cliff down the depth axis: 82.5% at L0 → 37.4% at L2 → 0.14% at L4 → 0.06% at L5, a ~270× drop from undergraduate to the frontier, the rich-poor gap widening from under 2× at literacy to ~75× at the frontier. About 99.86% of humanity only ever consumes knowledge; ~0.14% ever reaches the place where it is produced. Seven dimensions then describe the gradient's shape, and they converge. The historical arc (above) gives the spine: consume-access an unbroken staircase up, produce-access flat at every step. The five structural dimensions agree: cost is bimodal (a free path exists to read but none to produce), field coverage is wildly uneven (biomedicine has ~133× more researchers than mathematics), the temporal trend democratizes reading not production, the pipeline leaks worst at the undergraduate-to-graduate step, and a learner faces ~13 gates to read the frontier and ~18 to produce there, 11 of them structural barriers effort alone cannot pass. The geographic dimension shows the frontier is a near-monopoly: the top-10 countries hold 69.3% of the world's estimated researcher capacity, 35% of countries (75 of 217) have no researcher datapoint at all, researcher intensity has a Gini of 0.646, and — the sharpest equity signal — women now out-enroll men into university worldwide (+13 points) yet hold only ~33% of research posts, so the pipeline leaks post-degree, between the diploma and the lab. The modality dimension explains the gap mechanically: every scalable channel (informal/open, self-directed) ceilings out below the frontier, the one channel that reliably reaches production (apprenticeship, the lab) cannot scale, and that empty "scalable-and-production-reaching" cell is the consume-versus-produce gap. The causes are structural: an industrial schooling model built to sort rather than teach, a gatekeeping political economy in which academic publishers earn ~38% margins on donated labor selling publicly funded work back to the public, and a system that omits the highest-leverage capacities (learning-to-learn, the body, the ceiling on the ablest). Yet the corpus's foundations layer insists on a hard caveat the data cannot override: what education is for is an irreducible, contested value question — there is no single cross-civilizational definition of an educated person, and sorting, credentialing, and socialization are legitimate functions, not merely pathologies. So any reform is a value choice and must be stated as one. The evidence on what works points to structured, human-mediated levers (Teaching at the Right Level, tutoring at ~0.37 SD, metacognition) and against folk theory (learning styles is null). The highest-leverage region for the specific goal of opening advanced knowledge is the L3→L4→L5 zone: the comprehension bridge from established knowledge to the frontier, an author-routed production economics, and non-institutional, any-age frontier access — restated by the modality data as the prize that has never existed, the first channel that scales all the way to production. AI is the first technology in the entire 5,000-year arc — and the first modality — for which the consume-versus-produce verdict is not yet written; the number to watch is whether the produce-access rate moves. Bucket Foundation's open-knowledge thesis is named here as one defensible choice among the contested aims* — honestly bounded: it does not fix K-12 funding, teacher pay, or the access and learning emergency in poor states. The one-sentence finding: for five thousand years the world widened reading and never widened producing, building a broad shallow base and a thin, gated, unequal peak — and the deepest inequity, the emptiest market, and the one place the historical pattern might finally break all sit in the same corner, at frontier access and the ability to produce knowledge.
1. Introduction: the question under the question
Education debates almost always measure the wrong axis. They ask whether children are enrolled — whether a body is in a classroom — and treat the answer as the score. By that measure the world has largely won: primary enrollment is near-saturation in most of the planet, and global adult literacy stands at 87.7%. The industrial expansion of mass schooling was, on its own terms, one of the great democratizing achievements of the modern era, and any honest account must concede that first (docs/deep/02 §4.4).
But enrollment is a single point on a much larger surface. The harder question — the one this atlas was built to answer — is: for a person of a given age, how deep into a body of knowledge can they actually go, at what cost, against how many gates; and what fraction of humanity ever reaches the frontier where new knowledge is read, let alone produced? That reframing changes everything, because the failures invisible to the enrollment statistic are exactly where the deepest inequities live.
To make the question tractable the corpus lays it on a two-dimensional grid (docs/landscape/02 §0; the axes are a constructed analytical frame defined in analysis/landscape/scale.py, while the access proxies mapped to them are real data):
- X — Age / life-stage:
0–5·5–18·18–22·22–65·65+. - Y — Knowledge depth, a six-rung ladder:
- L0 basic literacy / numeracy
- L1 K-12 / secondary
- L2 undergraduate
- L3 graduate / professional
- L4 the frontier — reading primary, peer-reviewed and preprint research
- L5 producing new knowledge — actually doing research
The split between L4 and L5 — reaching the frontier versus adding to it — turns out to be one of the load-bearing distinctions in the whole analysis, because the data shows them as almost the same sliver, and because the one place a free path opens at the top (reading) is precisely not the place the gradient is most closed (producing).
The reason this matters for reform is that a reform agenda is only as good as its map of the terrain. If the binding constraint is age (when in life you get access), you fund pre-K and lifelong learning. If it is depth (how far up the ladder you can climb), you attack the cliff. If it is income (who can buy depth), you attack the gradient. The rest of this document shows the binding constraint is depth, bought by income, gated by institutions — and then asks, honestly, what a foundation can and cannot do about it.
1.1 The 5,000-year spine: every knowledge technology widened reading, none widened producing
Before the cross-section, the arc — because the present-day cliff is a single frame of a film that has been running for five thousand years, and the film tells one story (docs/landscape/06). Read end to end, the history of knowledge technology resolves into a single, almost unbroken pattern:
*Every prior technology widened access to consume knowledge — to read, learn, and reach what others had already discovered. None widened access to produce it — to originate, validate, and add to the frontier.*
The ledger is consistent across every era. Oral tradition stored knowledge in living memory: access was in one sense universal within the group but capped by the lifespan of that memory, and neither consuming nor producing scaled. Writing (~3200 BCE) created the first external store — knowledge could now persist and travel — but literacy stayed in the low single digits and a hand-copied codex cost a craftsman's annual income, so reading widened only slightly and producing narrowed to scribes and cloisters; the medieval university (Bologna ~1088) professionalized scholarship and built the first version of the credential gate still standing at L3–L5 today. The printing press (~1440) is the canonical case and the hinge of the whole arc: between 1450 and 1500 the real price of a book fell by roughly two-thirds (≈ −2.4%/yr for a century; Dittmar 2011, QJE), output rose by about four orders of magnitude per century (Buringh & van Zanden 2009, JEH), printing cities grew ~60% faster than comparable non-printing cities (1500–1600), and the press became the diffusion layer of the Reformation and a precondition for the Scientific Revolution — yet it did almost nothing for who could originate: an author still needed literacy, a press, and a patron. A giant jump in consume-access; a negligible one in produce-access. Public libraries and mass schooling (19th c.) took literacy from about 12% in 1820 — fewer than 100 million people alive could read — to about 88% in 2024, over five billion people (Our World in Data, on Buringh & van Zanden + UNESCO), the single largest consume-access expansion in history by headcount; but the same century enclosed production behind the professionalized PhD, widening the pool while hardening the gate. The internet and Wikipedia (1990s–) drove the marginal cost of a copy to zero (penetration 0 → ~68% online, ~5.5B people) and put the bulk of reference knowledge in front of anyone with a connection — abundance of reading; produce-access at the frontier unmoved. Open access and preprints (2000s–) are the most important entry of all, because they are the first technology to push consume-access all the way to L4 — reading the primary research frontier itself (open-access share of new papers quadrupled 12% → 54%, 2000–2024) — and still produce-access did not move: the rent simply relocated to the author side as article-processing charges (Nature's OA APC on the order of $12,850), so open access excludes poor authors where subscriptions excluded poor readers.
The consume column is an unbroken staircase up; the produce column is flat — gated, narrowed, or unchanged — at every step. This is the same consume-versus-produce distinction the L4/L5 split encodes, extended from a cross-section into a thesis about technological history, and it is the spine on which everything below hangs.
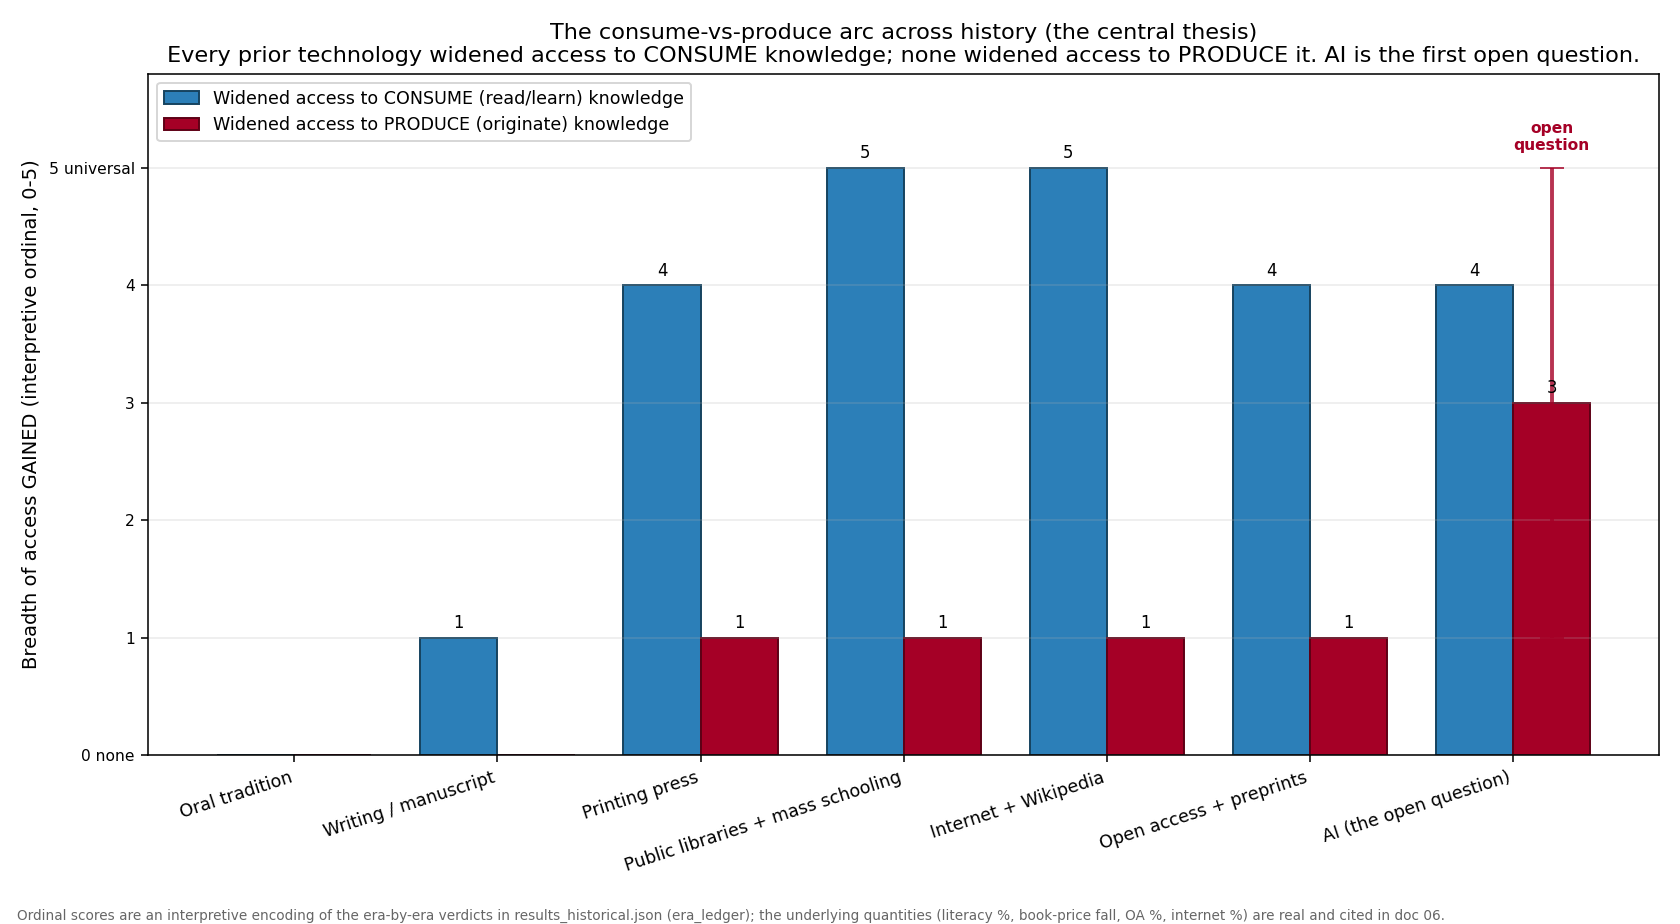
The present tense is the last two frames. AI in the 2020s is the first entry in the entire arc where an honest analyst cannot yet sign the verdict — it might be the most powerful reading-amplifier ever built and nothing more (the prior, given five thousand years of the pattern holding), or it might be the first technology that lets a non-institutional person do research rather than only consume it. §6 returns to this as the reform question; the number that decides it is whether the produce-access rate of ~0.14% ever moves. With the spine in place, the rest of this document is the cross-section of the arc's final frame: where the cliff is today, what shape it has across seven dimensions, why it is shaped that way, and what — honestly — can be done about it.
2. The measurable state: three crises, an access cliff, and a consume-versus-create gap
2.1 Three crises stacked on top of each other
The quantitative atlas holds 78,326 observations across 219 countries and 30 indicators, scoring 5,036 country × level × indicator problem profiles against SDG 4 benchmarks (docs/EDUCATION_PROBLEMS.md). Read top to bottom it tells one story in three layers.
The learning crisis is the deepest. Learning poverty — the share of 10-year-olds who cannot read and understand a simple text — is 48.3% worldwide (World Bank SE.LPV.PRIM). Nearly half of all children reach age 10 unable to do the one thing primary school exists to teach, and these are children in school. It is wildly unequal: 86.5% in Sub-Saharan Africa against 8.6% in Europe & Central Asia — a tenfold gap, and the single best predictor of whether a child can read at 10 is the country they were born in.
The access crisis has shrunk but not closed, and it has migrated up a level. At least 51.2 million primary-age children remain out of school (a lower bound: a sum of latest-available country values, since broken states do not report). As primary access approached saturation, the bottleneck moved to the next rung — 61.2 million adolescents are out of lower-secondary school. The frontier of the access problem is now the years on either side of primary: pre-primary, the world's least-universal level, and the lower-to-upper-secondary transition where the system loses adolescents in tens of millions.
The financing crisis underwrites both. World education spending is 3.6% of GDP — below the 4% floor of the Education 2030 / Incheon Framework — and 92 of the ~200 countries with data invest less than 4%. Nearly half the world's governments underfund education relative to the globally agreed minimum. This is the most actionable finding in the atlas: a policy lever, not a mystery.
Two patterns recur across the worst-off rankings: conflict and fragility (South Sudan, Somalia, Afghanistan, the Central African Republic appear across every category), and the coincidence of crises in single countries — Nigeria sits at the top of both learning and financing severity. A subtler signal is South Africa, an upper-middle-income country with near-universal access that nonetheless ranks among the worst on learning outcomes: money and enrollment are necessary but not sufficient; quality is its own problem. That single observation is the hinge between the measured crises and everything structural that follows.
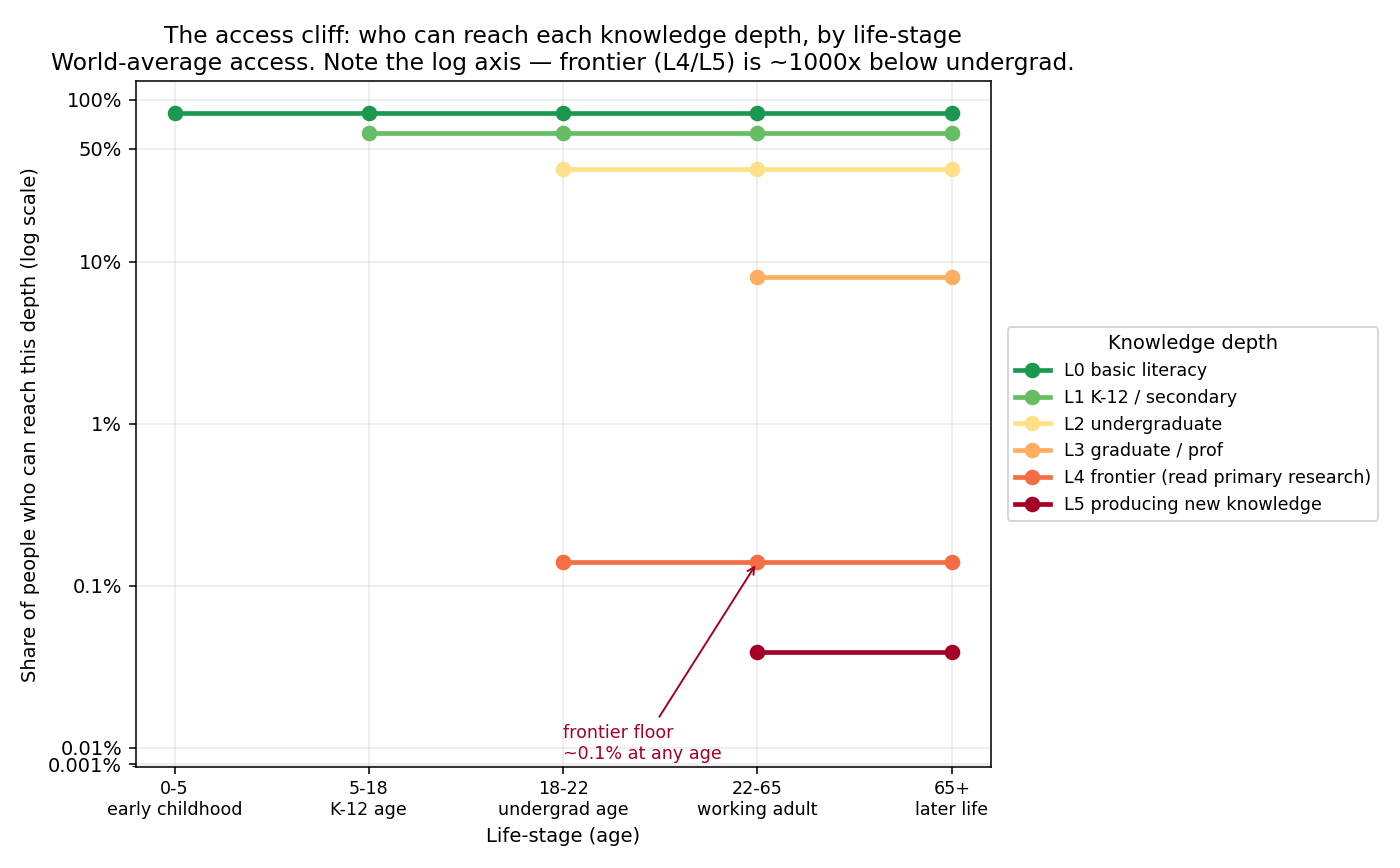
2.2 The access cliff is down the depth axis, not across age
Now lay the same world on the age × depth grid. The reproducible analysis (analysis/landscape/results.json, real anchors for L0–L2 from World Bank EdStats, a real UNESCO UIS researchers-per-million anchor for L4, documented estimated multipliers for L3 and L5) produces this world-average access by depth:
| Depth | World access | Status |
|---|---|---|
| L0 basic literacy | 82.5% | real |
| L1 K-12 / secondary | 62.4% | real |
| L2 undergraduate | 37.4% | real |
| L3 graduate / professional | 8.1% | est. multiplier on real base |
| L4 frontier (read research) | 0.14% | real UNESCO anchor |
| L5 producing new knowledge | 0.06% | est. multiplier on real anchor |
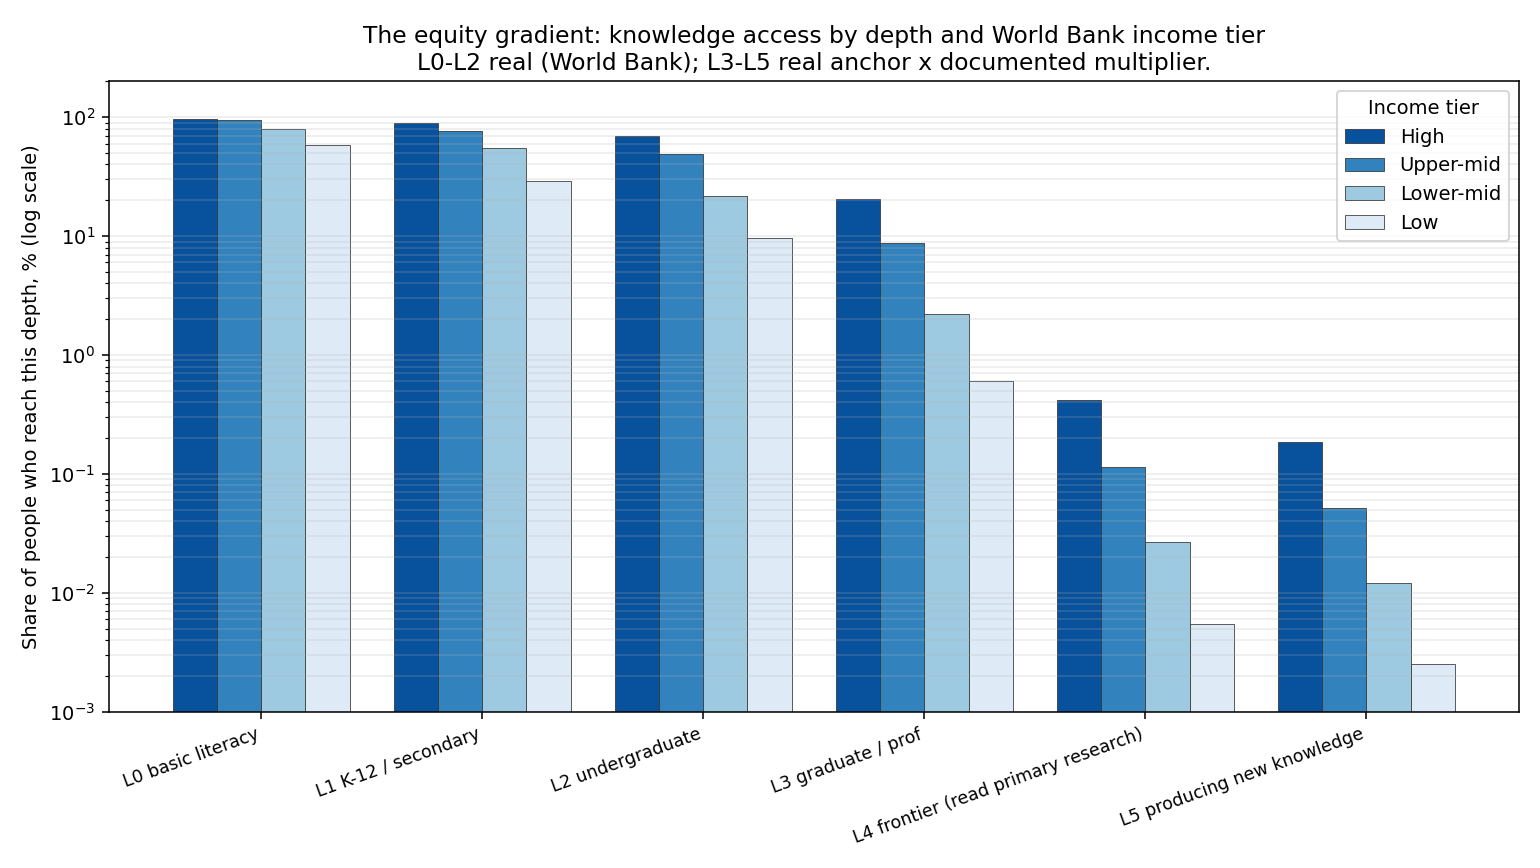
The drop from undergraduate (37.4%) to the frontier (0.14%) is a ~270× fall. Within any life-stage, access barely changes with age — lifelong access keeps the lines flat — so the cliff is the vertical distance between rungs. Depth, not age, is the binding constraint. No income tier's typical person reaches graduate depth: the median ceiling is L2 (undergraduate) in high-income countries, L1 (secondary) in the two middle tiers, and L0 (basic literacy) in low-income countries.
And the cliff is bought by income. The gradient is shallow at the bottom and brutal at the top (docs/landscape/02 Finding 2):
| Depth | High | Upper-mid | Lower-mid | Low | HIC ÷ LIC |
|---|---|---|---|---|---|
| L0 literacy | 97.2% | 94.4% | 79.7% | 58.7% | 1.7× |
| L1 secondary | 88.8% | 76.8% | 54.7% | 29.2% | 3.0× |
| L2 undergrad | 68.8% | 49.1% | 21.9% | 9.7% | 7.1× |
| L3 graduate (est) | 20.6% | 8.8% | 2.2% | 0.6% | ~34× |
| L4 frontier (real) | 0.42% | 0.12% | 0.027% | 0.0055% | ~75× |
At literacy the rich-poor gap is under 2×; by the frontier it is ~75×. The inequality widens with depth — the higher up the ladder, the more decisively income decides who climbs.
2.3 The consume-versus-create gap
The single most dramatic number in the corpus follows directly. World researchers per million is ~1,360, so ~0.136% of humanity is at the knowledge frontier and ~99.86% only ever consume it (docs/landscape/02 Finding 4). The frontier gap is steeply unequal — 0.42% in high-income versus 0.0055% in low-income countries, the ~75× ratio again — and L5, actually publishing, is a smaller sliver still.
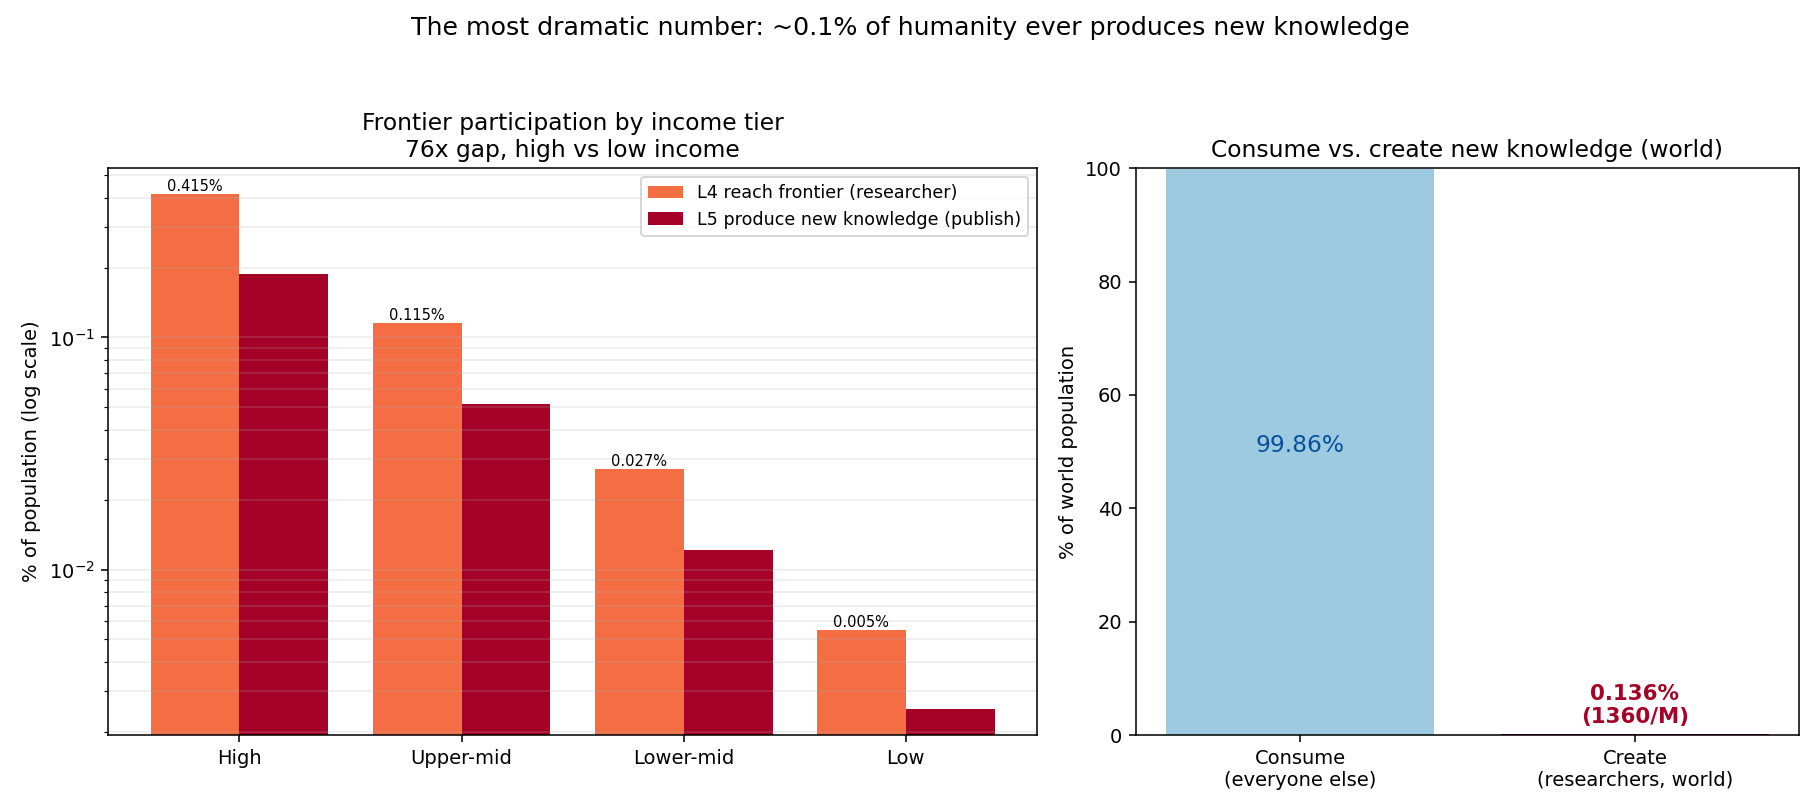
This is not a single-method artifact. An independent bottom-up count from the research-atlas OpenAlex-derived corpus holds 1,438,636 distinct researchers, of whom 320,879 are currently active publishers — confirming that the population producing knowledge is on the order of 10⁶, a fraction of a percent of the ~8×10⁹ humans alive. The UNESCO per-capita anchor and the corpus headcount agree on the order of magnitude.
So the measurable state, in one line: the world solved the classroom door and the literacy floor, has a real but narrowing access problem at the secondary edges, and an unsolved quality problem inside the building — but above all of that sits a depth cliff so steep that the ability to reach, let alone produce, new knowledge is held by about one person in seven hundred, and which person depends overwhelmingly on income.
3. The shape of the gradient: the dimensions of the cliff
The base map says where the cliff is. The historical arc (§1.1) already said when and gave the spine. The remaining dimensions say what shape the present-day cliff has — and every one of them relocates the binding constraint from consumption to production, the same verdict the arc delivers across time. Five structural dimensions (analysis/landscape/results_expansion.json, docs/landscape/03) describe the cliff's cost, field, temporal, continuity, and latency shape (§3.1–3.5); a geographic dimension (results_geographic.json, docs/landscape/05) maps where on Earth the frontier capacity sits and who is shut out (§3.6).
3.1 Cost: bimodal — free to read, no free path to produce
The cost-to-reach-each-depth curve is bimodal, not monotone. Reaching the floor (L0–L2) and reading the frontier (L4) both have a genuine $0 path — public schooling, open educational resources, and open access (arXiv, PMC, PLOS, Unpaywall). But there is *no free path to produce knowledge: graduate credentialing (L3) starts at ~$12k/yr, and doing research (L5) costs ~$50k–150k per researcher-year, the most expensive rung on the grid. The sharpest single number on the paywall side is Nature's 2026 open-access article-processing charge: $12,850 to publish one article.*
| Depth | Cheapest legit path | Free $0 path exists? |
|---|---|---|
| L0–L2 | $0 (public schooling, OER, OCW) | Yes |
| L3 grad/prof | ~$12k/yr (public grad) | No |
| L4 read frontier | $0 to read OA; $35–50 per paywalled article | Yes — to read |
| L5 produce | ~$50k–150k/researcher-year | No |
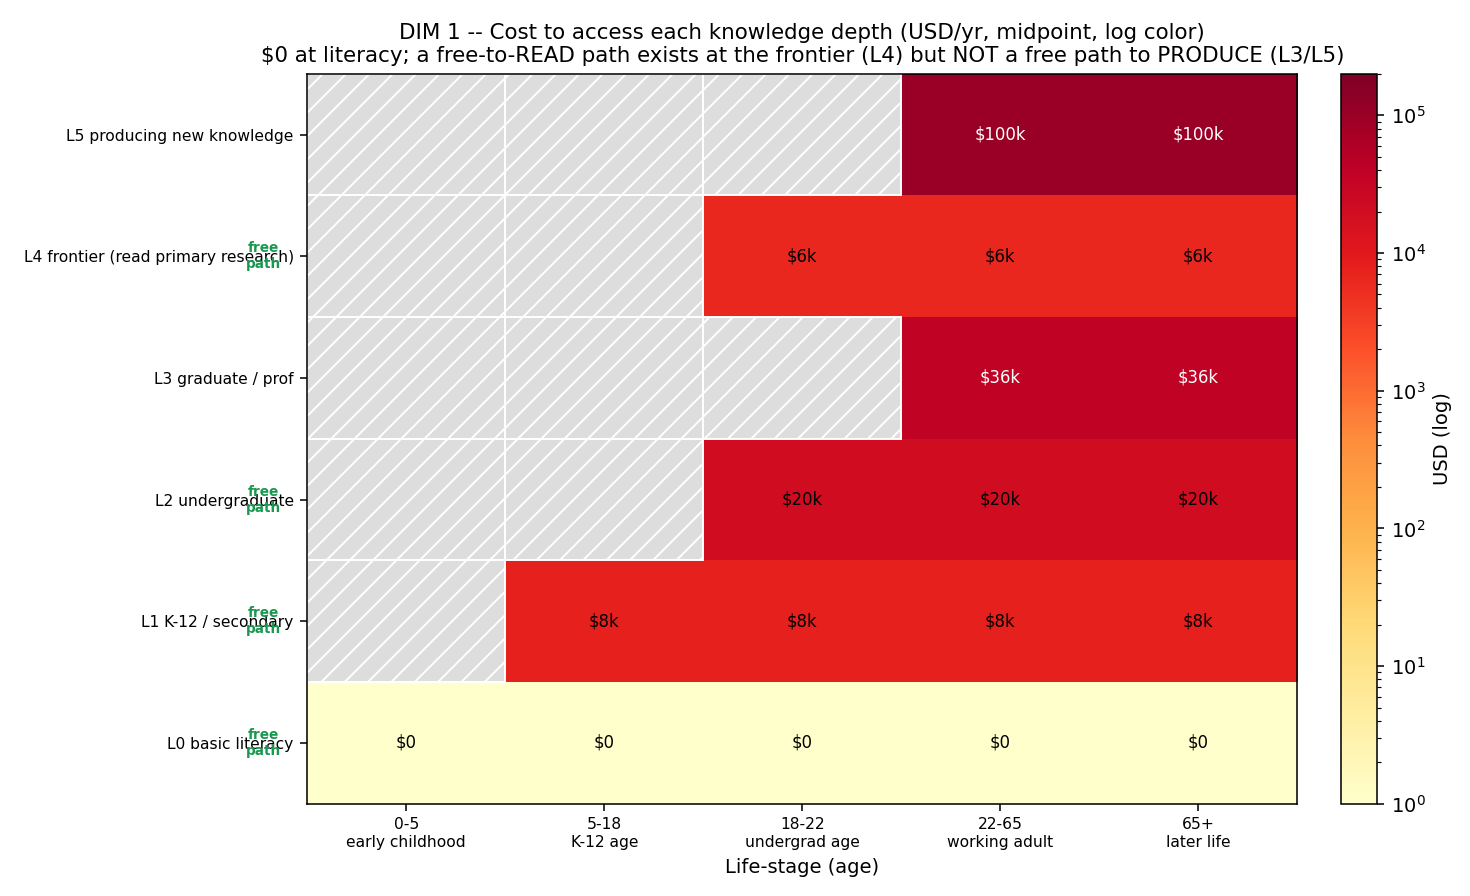
The economic cliff is therefore not "the frontier is expensive to read" — that is increasingly free — it is that producing knowledge has no free on-ramp. (The dollar anchors are real cited 2024–2026 figures but US/OECD-leaning; the shape generalizes, the exact dollars do not.)
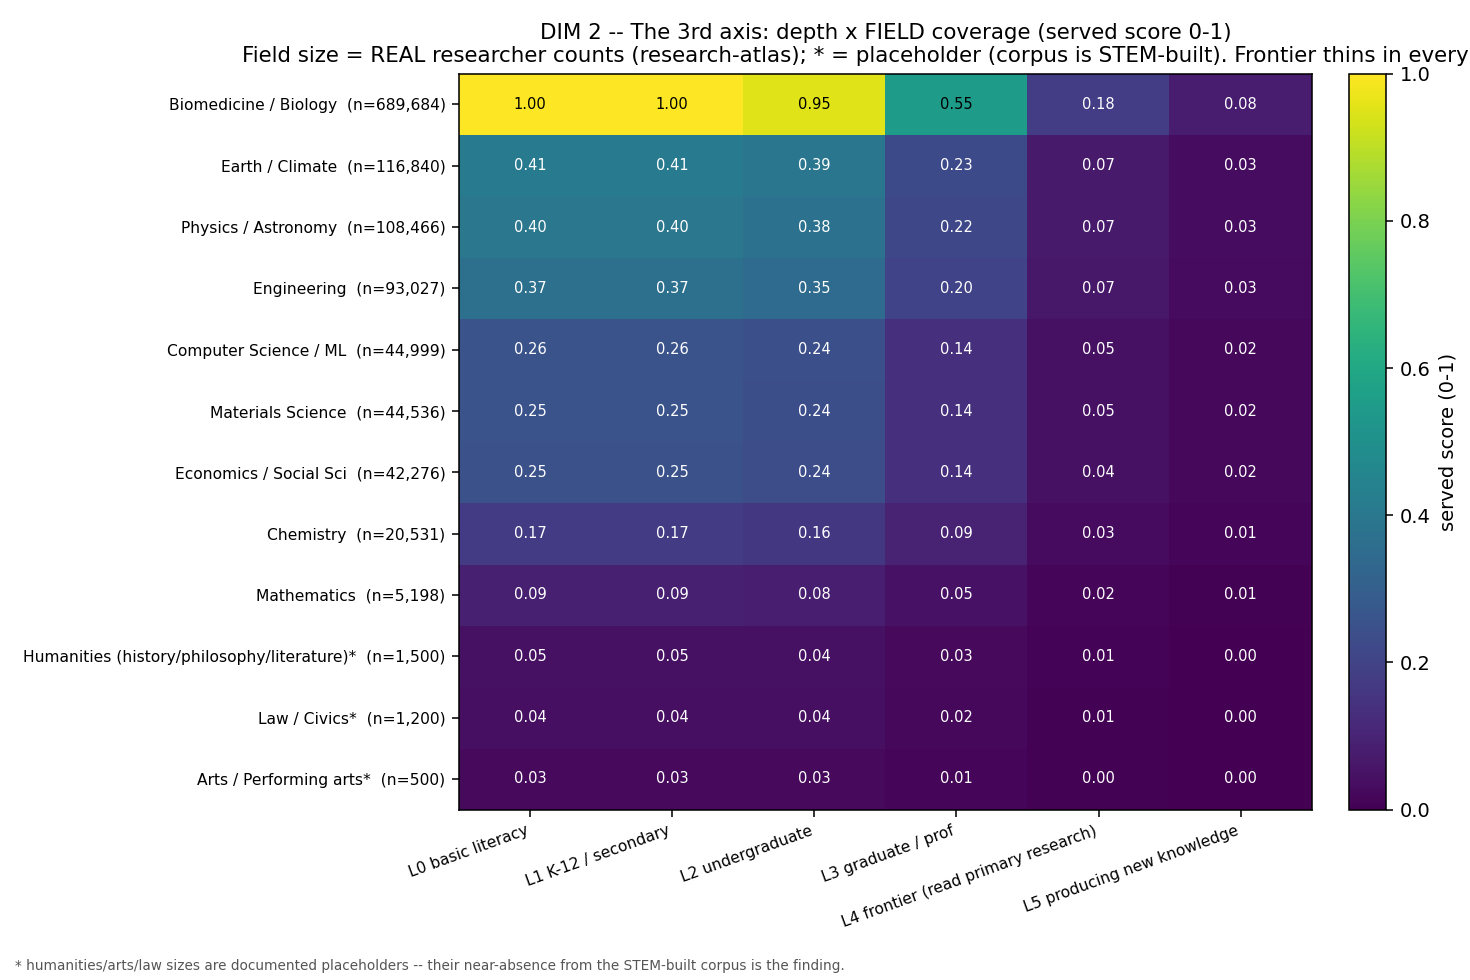
3.2 Field: depth is served wildly unevenly across disciplines
Coverage is not uniform across knowledge. Using real research-atlas researcher-per-field counts as field size, biomedicine has ~133× more researchers than mathematics (689,684 vs 5,198) and the frontier thins within every field — the L4 served-score is below the L2 score in every discipline. The humanities, arts, and law are structurally absent from the STEM-built frontier infrastructure entirely; their near-zero presence is not a data gap to apologize for, it is the finding — preprint servers, discovery tools, and AI research assistants are overwhelmingly built for biomedical and physical science.
3.3 Temporal: reading is democratizing, producing is flat
Is access getting better? For reading, decisively yes. The open-access share of new papers quadrupled from 12% (2000) to 54% (2024), crossing 50% in the early 2020s, while global internet penetration grew ~10× from 6.7% to 68%, and a stack of free tools arrived — arXiv (1991), Google Scholar (2004), the PMC mandate (2008), bioRxiv (2013), Unpaywall/Semantic Scholar (2015), OpenAlex plus scaled LLM research tools (2022), and autonomous science agents (2024). The read-access cliff is eroding fast.
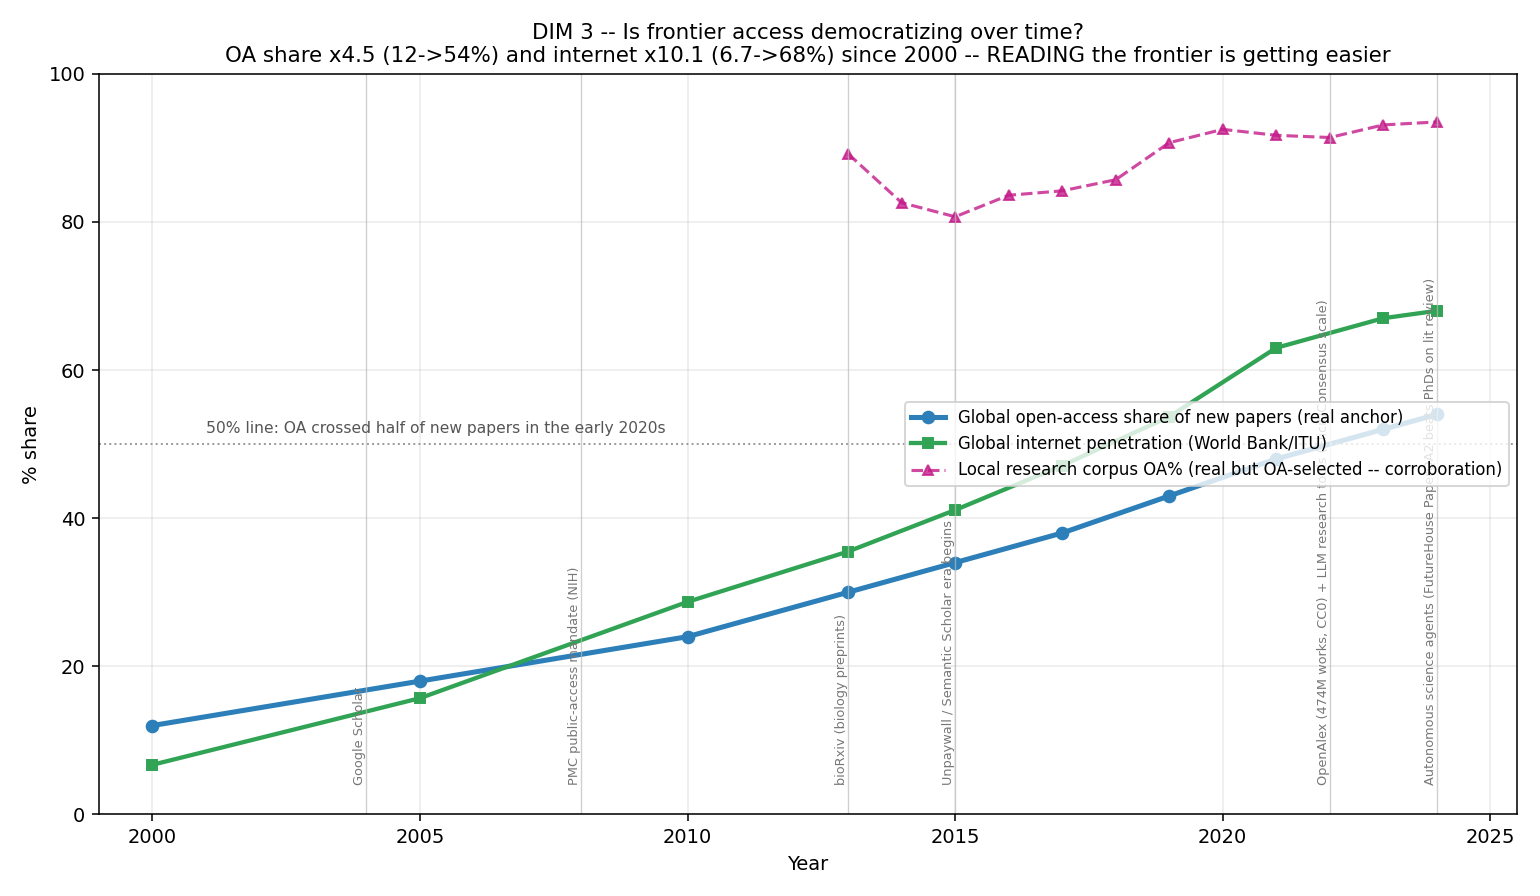
But this curve touches L4 (reading) only. It does not move the L4→L5 production rate, pinned at ~0.136% of humanity, which has no comparable democratizing trend. The honest answer: *access to consume the frontier is democratizing; access to produce it is persistent.*
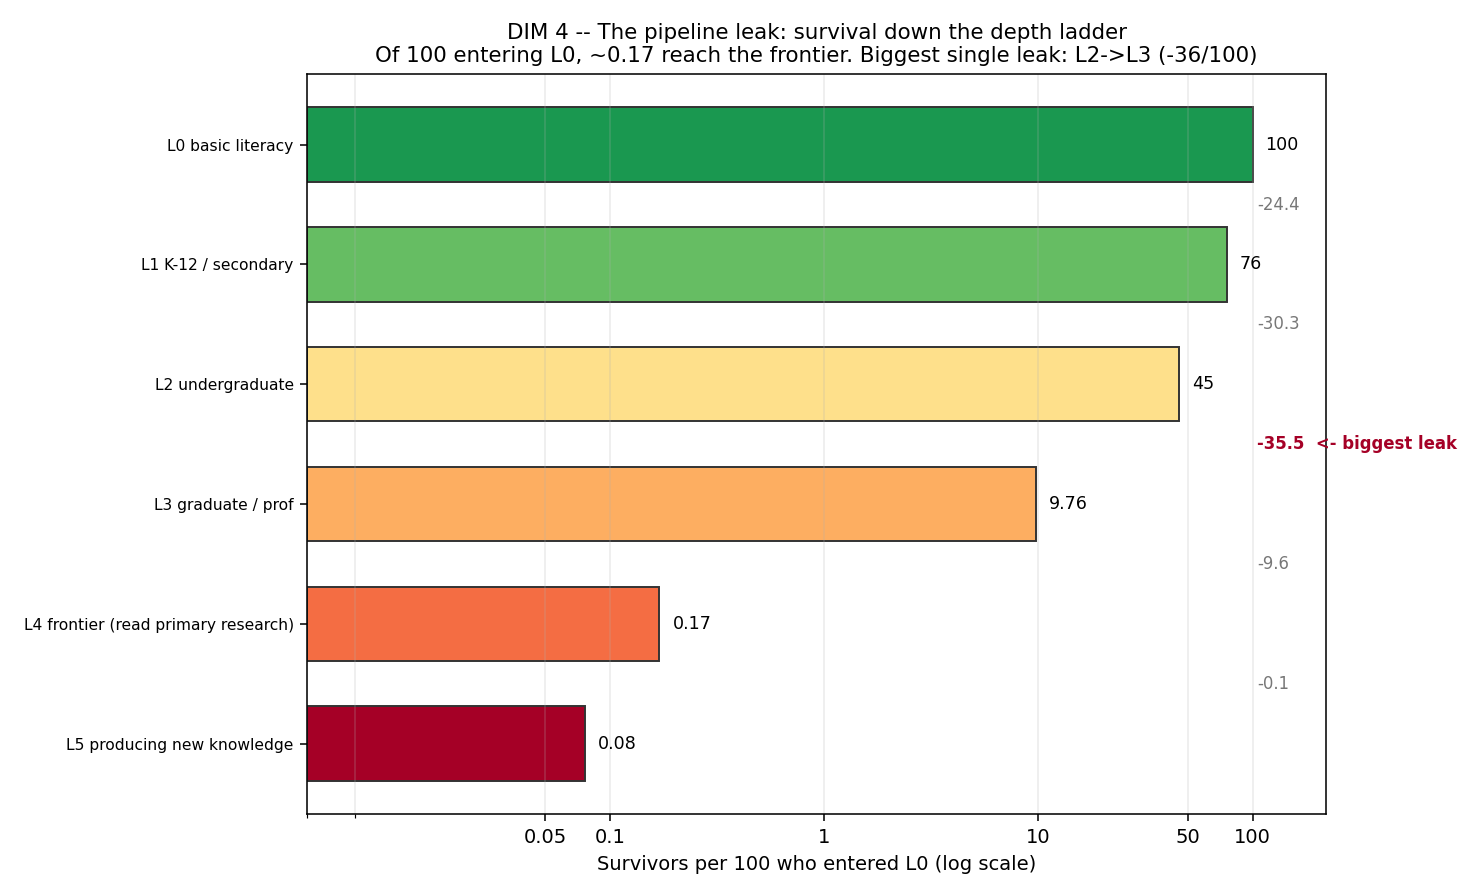
3.4 Continuity: the funnel and its biggest leak
Of 100 people present at L0, how many survive to each deeper rung (the base-map world-average normalized to the L0 cohort — a cross-sectional presence curve, not a tracked longitudinal cohort)?
| Depth | Survivors per 100 | Drop from previous |
|---|---|---|
| L0 literacy | 100.0 | — |
| L1 K-12 | 75.6 | −24.4 |
| L2 undergrad | 45.3 | −30.3 |
| L3 grad/prof | 9.76 | −35.5 ← biggest leak |
| L4 frontier | 0.17 | −9.6 |
| L5 produce | 0.077 | −0.09 |
The biggest single leak is L2→L3, the undergraduate-to-graduate gap, which loses ~36 of every 100 who entered. The pipeline does not empty at the bottom (literacy retains 76%); it empties in the middle-to-upper transitions. The conditional transition rates make this sharper still: only ~21.5% of those at L2 advance to L3, and only ~1.75% of those at L3 advance to L4 — the L3→L4 step is the worst conditional transition in the whole funnel. This is the quantified version of the unbuilt bridge from established knowledge to the frontier.
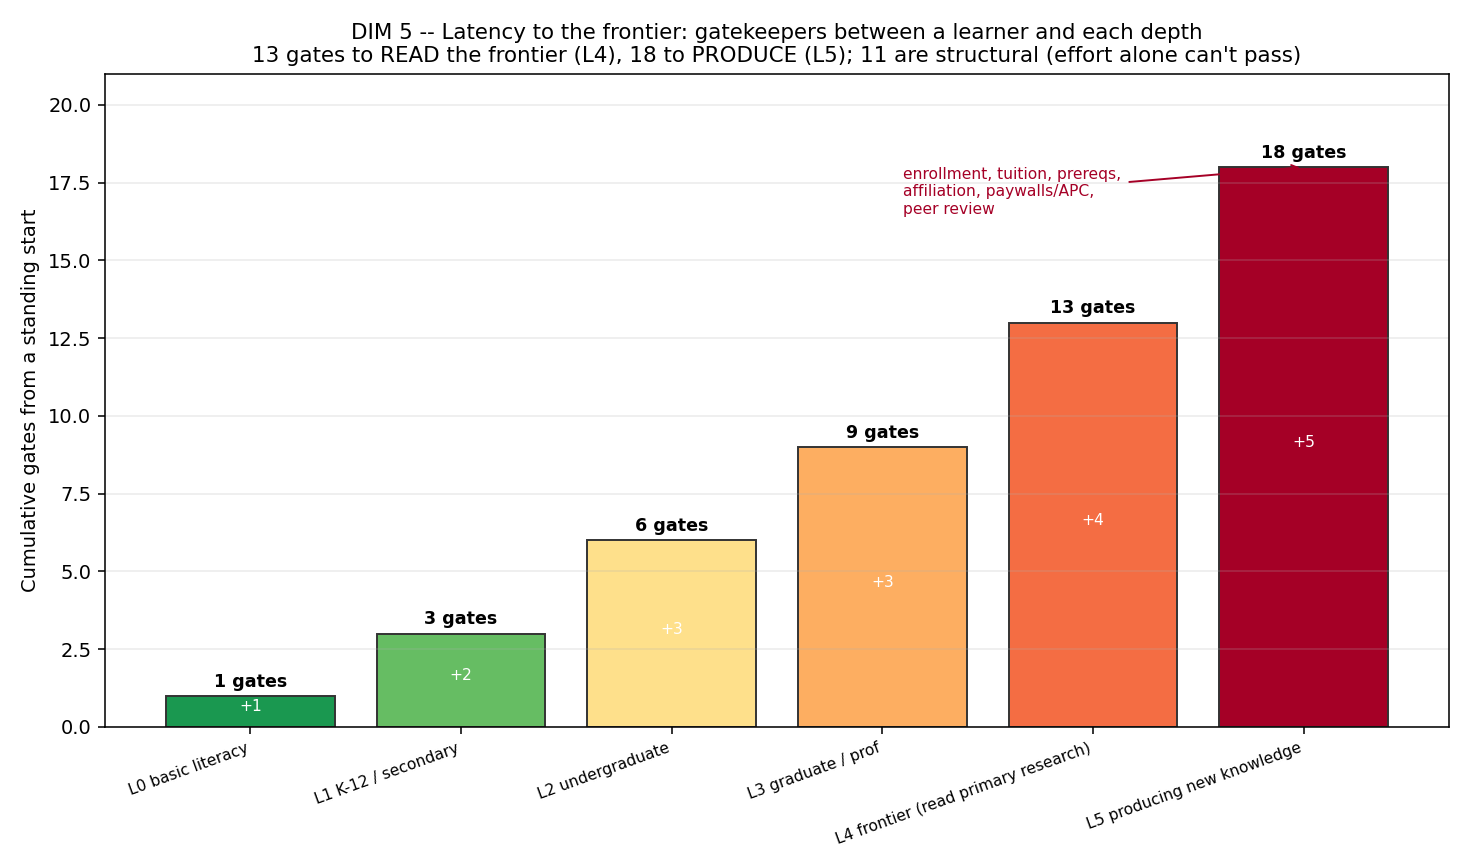
3.5 Latency: the stack of gates to the frontier
Finally, count the discrete gates between a motivated learner and each depth, cumulative from a standing start:
| Depth | Cumulative gates | Example new gate |
|---|---|---|
| L0 | 1 | literacy instruction |
| L1 | 3 | enrollment + years of attendance |
| L2 | 6 | diploma + admission + tuition |
| L3 | 9 | bachelor's + grad admission + grad tuition |
| L4 | 13 | grad training + institutional affiliation + paywall/APC + domain fluency |
| L5 | 18 | research position + funding + ethics approval + peer review + APC up to $12,850 |
A learner must clear *13 gates to read the frontier and 18 to produce* — and 11 of the 18 are structural* gates that effort alone cannot pass: tuition, admissions, institutional affiliation, paywalls/APCs, a funded research position, ethics approval, and peer-review acceptance. The latency to the frontier is not mainly a knowledge* barrier (which open access and AI tools now lower); it is a stack of institutional and financial gates concentrated at exactly the L3→L4→L5 transitions where the pipeline leaks worst.
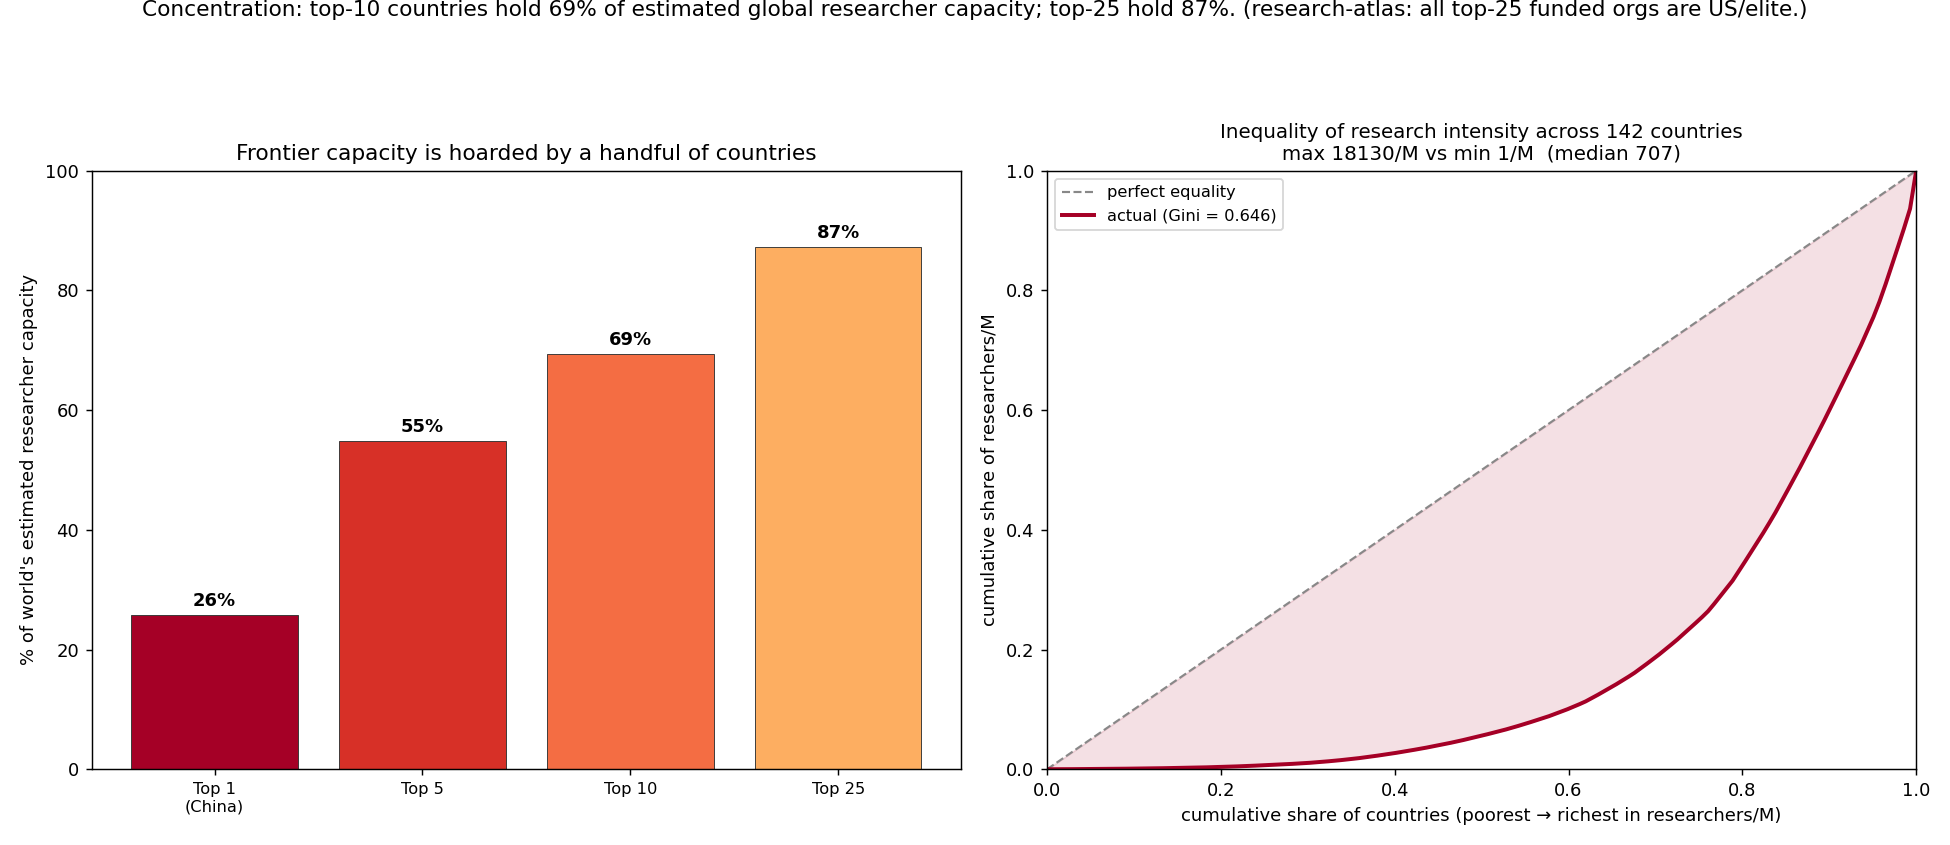
3.6 Geographic: the frontier is a near-monopoly held by a handful of countries
The five structural dimensions say what shape the cliff has; they cannot say where on Earth its top sits. The geographic dimension does (docs/landscape/05, analysis/landscape/results_geographic.json), pulling the same UNESCO/World Bank researchers-per-million anchor doc 02 used as a tier mean (SP.POP.SCIE.RD.P6) into a real per-country map, and the picture is a near-monopoly.
First, the coverage finding, which is the most honest result in the layer because it is what's missing: of 217 real countries, only 142 have any researcher-per-million datapoint at all — 75 countries, 35% of the world, have NONE. These are overwhelmingly low- and lower-middle-income, in Sub-Saharan Africa, small island states, and conflict-affected regions. The absence is not noise — it is the finding: a country with no measured research capacity is one whose frontier participation is so thin (or whose statistical capacity is so weak) that the world's flagship R&D indicator has no value for it. Every low-income number in this synthesis is therefore an upper bound on a darker reality.
Second, the concentration. Estimating each country's absolute frontier capacity as researchers/M × population (both real series; the product is an estimated headcount) across the ~142 data-carrying countries gives ~11.5 million researchers, and it is hoarded:
| Group | Share of world's estimated researcher capacity |
|---|---|
| Top 1 (China) | 25.7% |
| Top 5 (China, US, Japan, Germany, Korea) | 54.9% |
| Top 10 | 69.3% |
| Top 25 | 87.3% |
China and the United States alone hold ~40%. The top-10 countries hold roughly seven-tenths of the world's frontier capacity; the top-25 hold almost nine-tenths. A Lorenz curve of researchers/M gives a Gini of 0.646 across 142 countries — research intensity is more unequally distributed than income is within most countries — with a ~13,000× span from the most to least research-intensive country and a composite frontier-access index running 92 (Korea) to 17 (DR Congo). By region, Sub-Saharan Africa averages an index of 31 against Europe's 77 — less than half — and its researcher intensity averages ~130/M against North America's ~5,280/M. The concentration is fractal: the research-atlas org-level mirror finds all top-25 funded research organizations are US/elite institutions, so the country-level near-monopoly repeats at the institution level.
Third, the gender cut, which sharpens the continuity finding of §3.4. Women now out-enroll men into university nearly everywhere — world mean female tertiary enrollment 52.4% vs male 39.3%, +13.1 points (real World Bank SE.TER.ENRR.FE/.MA), the advantage widening with income and flipping negative only in low-income countries (−2.2 pts). Yet women hold only about 33% of research posts globally (UNESCO UIS Women in Science anchor), as low as 18.5% in South & West Asia and 21% in computing. So the leak is not at the classroom door — women enter higher education in equal or greater numbers — it is post-degree, between the diploma and the lab. That is the same L2→L3→L4 leak §3.4 quantified, now seen through gender: the pipeline's worst loss is at exactly the transition into the frontier, and women are routed out of it after they have already won the degree.
This geographic shell sits outside the depth cliff: inside each shut-out country the same gradient repeats by wealth and place (in low/lower-middle-income countries tertiary completion is ~9% of the richest quintile vs ~0.5% of the poorest — an ~18× gap inside one country; UNESCO GEM/WIDE anchor). The frontier is reached by a few countries, and within them, unevenly by gender, wealth, and location. (Researchers/M, tertiary, internet, and female/male enrollment are real per-country World Bank series; the composite index uses documented weights; absolute capacity is an estimate; women-in-research and wealth/rural figures are documented UNESCO anchors — full ledger in `docs/landscape/05` §7.)
The dimensional headline: the base map said depth is the binding constraint and income buys it; the dimensions say the binding constraint, properly stated, is production, not consumption. Reaching the floor and reading the frontier both now have a $0 path and are democratizing over time. Producing knowledge has no free path, is wildly uneven across fields, leaks worst at the L2→L3 step, sits behind 18 gates, is geographically a near-monopoly (top-10 countries ~69%, 75 countries off the map entirely, Gini 0.646), and leaks women out after the degree. Consuming the frontier is getting free and easy; producing it remains gated, expensive, STEM-concentrated, and held by a handful of countries.
4. Why it's shaped this way: the structural causes
The gradient is not an accident of nature. Three structures produce it.
4.1 The industrial model: a machine that sorts, not teaches
Three income tiers fail in qualitatively different ways — the rich world narrows, sorts, and declines (OECD math fell a record 15 points 2018→2022, a decline the OECD itself says predates COVID); the middle world won access and stalled on quality, often collapsing into exam factories (China's gaokao drew ~13 million candidates in 2026); the poor world fights the access and learning floors simultaneously under financing collapse and teacher absenteeism (teachers absent ~25% of the time in India, with per-learner public spend of $55 in low-income vs $8,543 in high-income countries, a 155-fold gap). But all three run on the same nineteenth-century operating system (docs/deep/02).
Honesty about the history matters: the popular "schools were built as factories to make factory workers" story is partly a myth — the genuinely factory-like monitorial system came first and was rejected for breeding thoughtless obedience; what spread worldwide was the Prussian model (age-batched, bell-timed, standardized, state-administered), imported to America by Horace Mann after 1843. The structural critique stands without the genetic myth. Stripped to mechanics, the inherited model standardizes a handful of choices, none of which follow from how humans learn: age-batching, time-not-mastery as the unit of progression, one curriculum at one pace for the median learner, sorting and ranking as the terminal function, and compliance as the affective curriculum. The serious critics — Illich, Freire (the "banking model"), Gatto, Ken Robinson, the access/ cost/quality "iron triangle" of John Daniel — converge on one diagnosis the U.S. case study (docs/deep/01) makes concrete at every level:
| Level | What the system optimizes | What learning needs |
|---|---|---|
| K-12 | Standardized test scores; age-batch advancement | Mastery before progression; depth over coverage |
| Accountability | Ranking on a proxy metric | Certifying a specific child learned a specific thing |
| Higher ed | The credential as a hireable signal | Capability that persists after the diploma |
| Funding | Fundable, incremental projects (NIH R01 success ~13%) | Patient, risky, frontier work |
| Pipeline | Producing degree-holders and grant-winners | Producing people who can reach a new layer of reality |
Each layer optimizes a measurable proxy (a score, a degree, a grant, a citation count) over the unmeasurable goal it was meant to stand in for (understanding, capability, discovery). This is Goodhart's Law operating across an entire national institution. And the research pipeline that manufactures the people at L5 is the cruelest instance: the U.S. runs the world's best research output (~$940B/yr R&D, ~72% of Nobel-producing institutions) on a process that over-produces PhDs ~7:1 relative to faculty jobs (~14% of bio PhDs reach tenure-track), warehouses them in precarious postdocs, pushes funded independence to age ~43 (up from 35.7 in 1980), and concentrates nearly all serious money in a few dozen elite institutions (in the research-atlas, all top-25 recipient orgs are U.S. elites). The "who gets to do research at all" gate is the L4→L5 cliff seen from inside.
4.2 The gatekeeping political economy: 38% margins on donated labor
The depth cliff has owners. At each level an institution controls the gate and profits from it (docs/landscape/04 Part 1): the state at L0–L1, universities at L2, universities plus professional licensure at L3, academic publishers at L4, and funders plus affiliation plus prestige at L5. The most concentrated, most profitable, and least defensible gate is L4.
Five firms publish roughly half of all peer-reviewed articles; Elsevier alone holds ~25% of the market. RELX's scientific/technical/medical division reported a 38.4% adjusted operating margin — a level that places a journal publisher alongside Apple and Google. The margin is an anomaly because the inputs are donated: authors assign copyright for free, peer review is unpaid (one 2021 estimate valued U.S. reviewers' time alone at >$1.5 billion / >100 million hours in 2020), editing is largely unpaid, and the customer is frequently the same public that funded the research, buying it back through library subscriptions. This is the public-funds round-trip: governments fund the work, researchers donate the writing and reviewing, and the public pays again to read it. When open access threatened the subscription model, the rent did not disappear — it moved to the front end as article-processing charges (APCs), which excludes poor authors instead of poor readers (total APC spend nearly tripled, $910M in 2019 to $2.54B in 2023). The single largest "solution" to the L4 gate is Sci-Hub, an outright shadow library — which is itself the strongest indictment of the legal gate (noted as illicit; not endorsed). Softer but stickier gates sit at L3 and L5: occupational licensure (the share of U.S. workers needing a license rose from <5% in the 1950s to ~25% today) and journal-prestige lock-in, a coordination trap no single researcher can defect from alone.
4.3 What the systems lack: learning-to-learn, the body, the ceiling
The gradient is also shaped by what the machine never builds — the capacities that don't fit on a standardized test and that Goodhart's Law therefore crowds out (docs/deep/03, docs/deep/04).
The highest-leverage missing skill is learning-to-learn. The cognitive science of how learning works is unusually settled — retrieval practice and spaced practice are high-utility; rereading and highlighting are low-utility — yet 84% of students study by rereading, and in one clean demonstration 90% of students learned better after spaced practice while 72% believed massing was more effective. Students systematically misjudge their own learning (the "fluency illusion"), and most have never been taught how to study at all. Metacognition and self-regulation rank among the highest-impact, lowest-cost interventions known — and are near-absent from both curricula and products. (The corpus is disciplined about its own talking points: the popular "learning styles" idea is a debunked neuromyth, and generic content-free "critical thinking" transfer is genuinely contested — reasoning helps when embedded in rich domain knowledge, not as a standalone class.)
The system also ignores the body the learner sits in. Sleep, daylight, movement, and nutrition are upstream determinants of whether encoding and consolidation happen at all — later school start times (a near-zero-cost lever), exercise's effect on executive function, iodine deficiency costing ~13.5 IQ points, lead with no safe threshold, vision and hearing correction among the cheapest high-certainty fixes in the literature. None of it appears in any global education indicator, and the neurotoxic and nutritional load falls hardest on the poorest schools, compounding the equity gradient. (The corpus draws a hard line here too: the established circadian/light science is held strictly distinct from the fringe extrapolations of the Jack Kruse corpus, which is cited only as a source of provocations, never as evidence of fact.)
And the system caps the top while failing the bottom. Ability measured early predicts real outcomes across the whole range with no right-tail plateau (the 50-year SMPY study); acceleration is the best-evidenced gifted intervention (g ≈ 0.70 versus same-age peers) and — the decisive equity finding — helps the top without harming the rest. Yet age-batched pacing, ceiling-bounded grade-level tests, and teach-to-the-middle hold the ablest at a fraction of their rate, for reasons that are mostly ideological and administrative, not evidentiary. The equity-versus-excellence tension is real and held, not waved away: for most of the world's children the binding problem is the floor, and a reform that led with the gifted would be misaimed — but the floor and the ceiling use different levers and need not compete for the same dollar.
5. What education is FOR: the honest caveat the data cannot settle
Everything above is descriptive: a measured gradient and its structural causes. It is tempting to read a reform agenda straight off it. The foundations layer of the corpus exists to stop exactly that move, and its finding is the most important constraint in this entire document.
There is no single, cross-civilizational answer to "what does it mean to be educated." The neutral survey (docs/foundations/01) lays the rival conceptions side by side — Greek paideia and Roman humanitas, Confucian self-cultivation toward the junzi, the Daoist counter-current of unlearning, the Hindu gurukula and Buddhist mind-training, Islamic ta'dib, African and Indigenous Ubuntu ("a person is a person through other persons"), Rousseau's natural development, Kantian autonomy, Humboldtian Bildung, Newman's knowledge-as-its-own-end, Deweyan growth, Peters' initiation into worthwhile activities, Freire's emancipation, the Sen-Nussbaum capabilities, MacIntyre's traditions, and Hirsch's cultural literacy — and shows that several of them flatly contradict one another. The disagreement is not a failure of analysis; it is a real feature of the question. There is no view from nowhere on what an educated person is.
Equally, the purposes of education are plural and the plurality is permanent (docs/foundations/02). Biesta's three functions (qualification, socialization, subjectification) and Labaree's three goals (democratic equality, social efficiency, social mobility) cannot be jointly maximized; every real system is a contested settlement among them. And — this is the part reform writing most often gets wrong — the functions usually cast as villains have legitimate versions. Sorting and credentialing solve a genuine allocation problem (some seats are scarce and someone must fill them; a transparent exam-based meritocracy is often fairer than the heredity and patronage it replaced; Spence's signaling theory shows credentials carry real information even if schooling added zero skill). Socialization is not mere conformity; Durkheim's point stands that no society reproduces itself without it, and cohesion is a precondition for the very freedom and critical thinking reformers prize. Even the contested categories at the heart of this atlas resist a clean verdict: cheating (docs/foundations/03) has two serious framings — integrity as a genuine moral and epistemic good, and "cheating" as a predictable artifact of high-stakes, gameable measurement — that converge on practice and diverge on meaning, a value question more data will not settle. And AI in education (docs/foundations/04) is equity-ambivalent by design: the same tool, under different policies, plausibly produces opposite outcomes, and the evidence is too thin to license confident prediction either way.
The consequence for this synthesis is strict. The data can tell us, with confidence, that the gradient is steep, gated, and unequal. It cannot tell us that closing it is the right aim, or which closing matters most, because "what for?" is a value choice, not an empirical one. Any reform is therefore a value choice and must be stated as one. The sections that follow name a high-leverage region and a specific thesis — but as one defensible option among contested aims, never as a conclusion the numbers dictate.
6. What works, and where the leverage is
6.1 What the evidence actually supports
Knowing where the gradient is steep is not the same as knowing what moves it. The intervention-effectiveness evidence (docs/landscape/04 Part 3; calibration: ~0.10 SD is small, ~0.30 SD substantial, >0.40 SD large and rare at scale) points to a clear pattern.
| Intervention | Effect size | Evidence |
|---|---|---|
| Teaching at the Right Level (Pratham) | 0.28–0.71 SD | Strong (6 RCTs) |
| High-dosage tutoring | 0.37 SD (0.25 at scale) | Strong (96+ RCTs) |
| Metacognition / self-regulation | ≈ +7 months | Strong (EEF) |
| Feedback / mastery learning | high (EEF top strands) | Strong |
| Conditional cash transfers | ~5 pp enrollment | Strong for access, weak for learning |
| Class-size reduction | ~+1 month | Moderate, poor cost-effectiveness |
| Ed-tech in classroom | mixed (≈0–0.44 SD) | Context-dependent |
| Learning styles | ~0 (null) | Strong evidence it does NOT work |
The through-line: the levers with the strongest, most cost-effective evidence are structured, targeted, and human-mediated — teaching at the right level, tutoring at sufficient dosage, building metacognition, tight feedback. The levers that disappoint are the ones that add resources without changing the interaction (smaller classes, tech for its own sake) or rest on folk theory (learning styles). The discipline this imposes: judge any intervention against ~0.3 SD as the bar for "substantial," not against the "2-sigma" marketing that animates the AI-tutoring field — real tutoring delivers ~0.25–0.37 SD at scale, and the early LLM-tutor RCTs (Nigeria 0.31 SD) are promising but short-term, facilitated, and single-context. Notably, metacognition is the rare case where the strongest evidence and the emptiest market cell coincide.
6.2 The white-space synthesis
Cross the solution map against the access map and the pattern is sharp. A census of 83 real players (docs/landscape/01) finds the grid crowded along the L0–L3 diagonal — early-childhood literacy apps, the densely packed K-12 cell, higher-ed/professional MOOCs and upskilling — and nearly empty at the top: only 31 of 83 players reach L4 or L5 at all, the L5 "doing research" cell has effectively two serious occupants (Elicit for the systematic-review stage; FutureHouse/Edison for autonomous discovery), and no product bridges the crowded L3 upskilling column up to the L4 frontier. The most-funded responses (personalization, content delivery, test prep) target problems the atlas ranks shallower; the atlas's deepest and most-neglected problems (learning-to-learn, the ceiling, doing research) coincide with the emptiest cells. Markets chase the payable middle; the structural problems are upstream or upmarket of where the money is.
The open-knowledge counter-movement scorecard (docs/landscape/04 Part 2) explains what is already won: it won access-to-read (open access at ~50% of new literature, preprints, shadow libraries) and the open plumbing (OpenAlex, ORCID, OER cost savings >$1.5B). It did not win the economics (APCs re-created the gate on the author side; prestige lock-in is untouched) and did not win the last mile (access is not the same as the ability to understand and use what is now reachable).
6.2a The modality lens: why the prize is the channel that has never existed
The white-space map says the empty cells are at the top. The modality dimension (docs/landscape/07) says why they are empty and what kind of thing would fill them — by adding the channel axis: not where the cliff is or who occupies a cell, but through what channel a learner climbs at all, and how far each channel can carry them. Five modalities, ordered most-scalable to least: formal (school→university→grad), informal/open (MOOCs, YouTube, Wikipedia, OER), self-directed (books, the open web), apprenticeship (the advisor, the lab), and AI-mediated (tutors, research agents). Each has a ceiling on the L0–L5 ladder past which it cannot, in practice, carry a learner.
Two facts off the modality table are load-bearing. First, the credential column and the L5 column are the same column: every channel that confers a recognized credential reaches production, and every channel that does not, does not — because the credential is the mechanism that opens the next institutional gate (admission, affiliation, funding) the 18-gate stack enumerates. Second, and decisively, reach and production-reach are inversely related. The informal/open channel reaches enormous numbers — Coursera alone 168M registered learners, ~220M MOOC enrollments, YouTube ~2.5B users (~51% using it to learn) — but ceilings hard at L2–L3: MOOC completion runs a median of ~12.6% (most courses 3–15%), no informal product carries a learner across the L3→L4 comprehension bridge, and the ceiling is the nature of the channel, not a quality failure. The self-directed channel has the highest theoretical ceiling (the open web plus open access reaches L4 in principle) and one of the lowest realized ones, because the autodidact-to-frontier cases that built the canon (Faraday, Ramanujan) almost always contain a hidden apprenticeship — and the structural gates have only risen since. Apprenticeship — the advisor, the lab — is the mirror image: the only channel that reliably reaches production (it transfers the tacit knowledge broadcast and self-study cannot; Bloom's "2 sigma" is the upper bound, ~0.25–0.37 SD the durable figure), and it cannot scale, because the supply of L5-capable mentors is bounded by the existing L5 population.
This is the load-bearing tension, and it draws the consume-versus-produce gap as a single empty cell:
| Scalable (reaches 10⁸–10⁹) | Does not scale (10⁵–10⁶) | |
|---|---|---|
| Reaches production (L5) | empty — the historic impossibility | Apprenticeship / the lab |
| Ceilings below production | Informal/open, self-directed, (AI today) | Formal's failed-funnel majority |
The top-left cell — a channel that is both scalable and production-reaching — has been empty for all of recorded history. That empty cell is the consume-versus-produce gap: the reason 99.86% only consume is that the only channels reaching most people stop at consumption, and the only channel reaching production cannot reach most people. (Formal education is the partial exception only because it bolts a scalable front end onto an apprenticeship back end and pays for it by shedding 99.9% of entrants before the back end — the §3.4 funnel.)
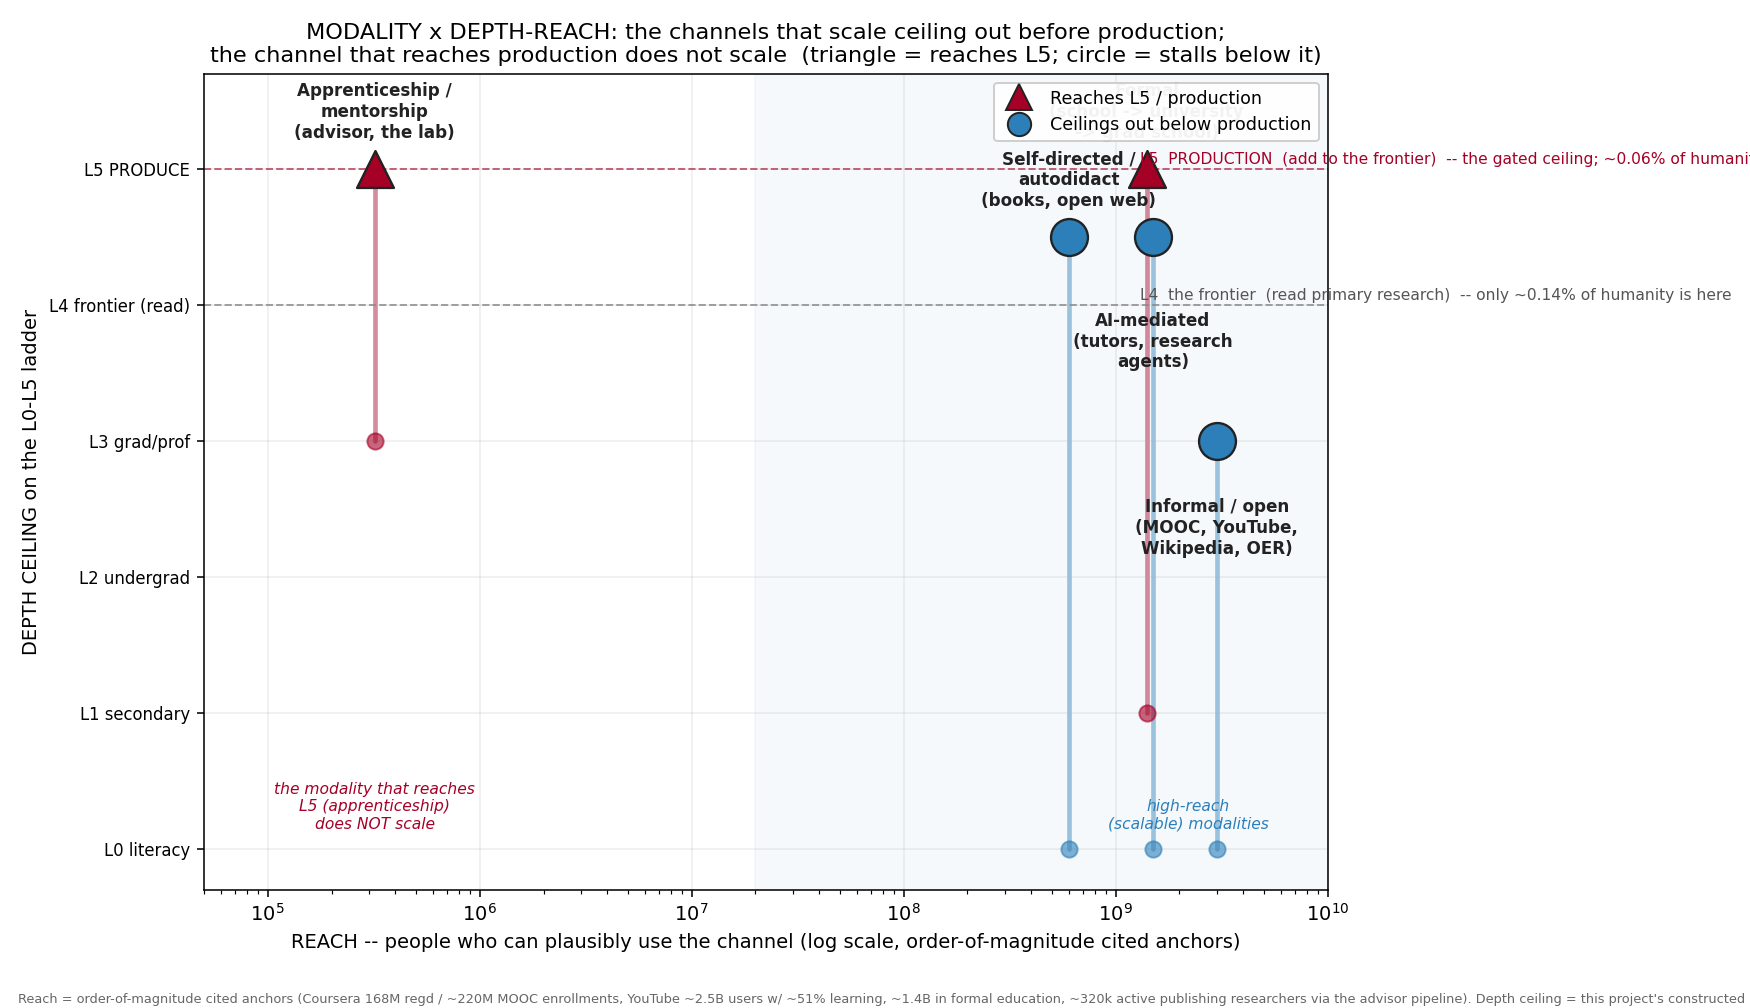
AI is the first serious candidate to fill that empty cell — natively scalable (marginal cost ~$0, reach ~10⁹) and the only modality that attacks both of the autodidact's missing pieces at once: the comprehension bridge (as tutor) and the tacit production layer (as research agent). The evidence is exactly as two-sided as §1.1's open verdict: a 2025 Harvard physics RCT found an engineered AI tutor produced ~0.73–1.3 SD over active-learning control but over two weeks, 194 students, middle-order skills; Stanford's Tutor CoPilot (a human-AI system, >700 tutors) found a more modest +4 pp. Read against the ~0.3 SD bar for "substantial," AI today is a powerful consumption amplifier with a higher ceiling — which would make it the next informal/open channel and no more. The upside case is that research agents (Elicit, FutureHouse/Edison, autonomous science since 2024) perform enough of L5's epistemic work that production stops requiring a human mentor. But the model can only carry a learner to the edge of production; clearing the non-epistemic gates (affiliation, funding, peer review, APCs) is a question about institutions and economics — which is exactly why the highest-leverage move below pairs an AI comprehension bridge with an author-routed production economics. The modality data says the prize is not more consumption reach — that cell is full — it is the scalable-production channel that has never existed.
The highest-leverage region for the specific aim of opening advanced knowledge is therefore the L3→L4→L5 zone, at the intersection of a won open-access asset, an unsolved gate, and a what-works mechanism:
- The L3→L4 comprehension bridge (highest leverage). Reading the frontier is largely
won; comprehension of it is not, and no product carries a motivated learner from "finished the courses" to "can read and contribute to primary research." The strongest what-works levers — tutoring (0.37 SD) and metacognition (+7 months) — are precisely the mechanisms that could build that bridge, applied to a target no current tutoring product aims at.
- Author-routed production economics (most defensible white space). The open movement
decisively failed to fix who gets paid when knowledge is produced and cited. A paid-to-cite, author-routed layer (the feed402/x402 lever) attacks the one gate the counter-movement left fully standing, and it sits on the won open-infra substrate rather than fighting it. It is orthogonal to what Elicit and FutureHouse do — they make doing research easier; none changes who gets paid.
- Non-institutional, any-age frontier access (the excluded user). Every L4–L5 tool
assumes an academic affiliation. Building the bridge and the economics for the self-directed, non-institutional, young-and-capable learner is the user-side white space, complementary to the open-access wins rather than competitive with them.
6.3 Bucket's position — named as one option, honestly bounded
Bucket Foundation's open-knowledge thesis (docs/REFORM_THESIS.md) maps onto this region: free-to-read primary research, paid-to-cite author-routed economics, research tooling that lets a motivated person do research rather than only consume it, and the canon as an open frontier for the few who can extend it. Stated against the foundations layer, this is one defensible value choice among the contested aims — a wager on the subjectification and knowledge-transmission ends, on the un-capped frontier and the ability to produce, made with open eyes about the rival aims (cohesion, equity, qualification) it does not prioritize.
And it is honestly bounded. Bucket is a foundation, not a ministry of education. It does not fix K-12 funding inequity, the teacher pay penalty, the student-debt overhang, completion gaps, the access and financing crisis in low-income states, or the floor-level learning-poverty emergency — those are state-capacity problems, and the proven levers there (TaRL, conditional cash transfers, the financing floor) are owned by states and NGOs. Open knowledge is necessary but not sufficient: a reachable frontier is useless to a learner never taught to direct their own learning, and irrelevant to a child who is not in school at all. The contribution is complementary — the top of the depth axis — and claiming otherwise would be the exact overreach this atlas was built to avoid.
7. Limitations
A synthesis that overclaims is worse than none. The honest boundaries of this evidence:
- Data sparsity is worst exactly where the problems are worst. Of the world's 25
low-income countries, only 11 have any learning-poverty data; PISA covers ~67 mostly-rich economies (India sat out 2022); conflict states top every severity list and report least. Every "worst-off" figure is a lower bound on a lower bound, and the 51.2M out-of-school primary figure is a sum of latest-available country values, not a modeled global total.
- The L0–L5 depth scale and the age bins are a constructed analytical frame
(analysis/landscape/scale.py), not an ISCED-exact mapping measured by any authoritative body. The access proxies mapped to each rung are real; the ladder is ours.
- Several headline cells are estimates flagged as such. L3 (graduate) is a real
tertiary-enrollment base × an estimated graduate-entry multiplier; L5 (production) is the real L4 anchor × an estimated active-publishing share; the cost surface uses real anchors with a derived midpoint; solution density and field served-scores carry documented assumptions. World-average rows are unweighted tier means, not population-weighted.
- The corpus has a STEM and anglophone lean. The research-atlas is STEM-built, so the
humanities/arts/law field sizes are documented placeholders (their near-absence is itself the finding, not a measured census), and cost anchors and many cited studies are US/OECD-centric — the shape generalizes, the exact numbers do not.
- The AI evidence is genuinely early. LLM-tutor RCTs are short-term, often facilitated,
and single-context (the strongest, Kestin et al. 2025, is two weeks, 194 students, middle-order skills, an engineered tutor; Tutor CoPilot is human-AI, not AI-alone); the deskilling/cognitive-offloading studies are correlational or small-n with methodological critiques. The corpus rates AI conditional, not solved, and so does this synthesis — in both the historical (§1.1) and modality (§6.2a) framings, the AI verdict is presented as a two-sided open question, not a prediction.
- The continuity funnel is a cross-sectional presence curve, not tracked individuals, and
the gate inventory is a representative enumeration, not exhaustive.
- *The historical arc's verdicts are interpretive.* The long-run series (literacy
12%→88% 1820–2024; book real-price collapse and output; internet and OA penetration) are real cited anchors, but the consume-versus-produce reading of each era is the analysis's interpretation, and the early absolute numbers are Europe/West-leaning (the Buringh & van Zanden corpus is European) — the shape of the staircase generalizes, the early absolutes do not. The 1950 literacy dip is a decolonization denominator artifact, not a true fall.
- The geographic layer rests on a data anchor that fails worst where access is worst. The
75 "off the map" countries are the extreme of an indicator that under-measures weak statistical systems, so the geographic concentration is if anything understated; absolute capacity uses latest-available years that differ by country; the composite index weights are a defensible choice, not a derived optimum (the ranking is robust to reweighting, the absolute scores less so); and women-in-research and rural/wealth figures are cited regional/global UNESCO anchors, not pulled per-country.
- The modality depth-ceilings are a constructed mapping. Where each channel "tops out" on
the L0–L5 ladder is the project's interpretive judgment on the constructed scale.py frame; the reach headcounts and completion rates are real and cited but measure different things (cumulative registrations vs active users vs enrolled stock vs producing headcount) and are used as orders of magnitude, not like-for-like. Real learners braid channels; the table idealizes a primary channel for analytic clarity.
8. Conclusion
For five thousand years the world widened access to read and never widened access to produce. The printing press, mass literacy, the internet, and open access each collapsed some barrier to consuming knowledge — and the rate at which humanity produces new knowledge held flat through all of it, near ~0.14%. The present-day cliff is the cross-section of that arc: a broad, shallow base of education and a thin, gated, unequal peak. The base is a genuine achievement — near-universal primary access, 87.7% adult literacy, the largest consume-access expansion in history by headcount — and the unsolved problems at the bottom (48% learning poverty, the secondary access edges, the financing floor) are real, larger by sheer scale, and the first moral priority. But the single steepest inequity in the entire record is not at the bottom. It is the depth cliff: access falls ~270× from undergraduate to the frontier, the rich-poor gap widens from under 2× at literacy to ~75× at the frontier, no income tier's typical person reaches graduate depth, and about 99.86% of humanity only ever consumes knowledge while ~0.14% ever reaches the place where it is produced. The newly mapped dimensions only sharpen the corner: the frontier is a geographic near-monopoly (top-10 countries hold 69.3% of researcher capacity, 75 countries have no datapoint at all, Gini 0.646), it leaks women out after the degree, and — mechanically — it is gated because every channel that scales stops below production while the only channel that reaches production cannot scale, an empty cell that has stood for all of recorded history. Reading the frontier is finally getting free and democratizing; producing it remains gated behind 18 barriers, 11 of them structural, with no free on-ramp anywhere. The deepest inequity, the emptiest market, and the one place the five-thousand-year historical pattern might finally break all sit in the same place — at frontier access and the ability to produce knowledge — and AI is the first technology, and the first modality, for which that verdict is not yet written; the number to watch is whether the produce-access rate moves. Whether to close that gap, and how much it matters relative to the floor, is a value choice the data cannot make for us; but the data can say, without qualification, exactly where the gap is, where it sits on Earth, how it is built, and that for five thousand years it has never moved.
Sources: World Bank EdStats (CC-BY-4.0); UNESCO Institute for Statistics (incl. Women in Science, GEM/WIDE); OECD PISA 2022; Our World in Data (incl. `cross-country-literacy-rates`); ITU Facts & Figures 2023; OpenAlex / research-atlas; the economic-history literature on print and literacy (Buringh & van Zanden 2009, JEH 69(2):409–445; Dittmar 2011, QJE 126(3):1133–1172); NCES, NSF/NCSES, EPI, FREOPP, NSC; Coursera FY2024 results, Pew (2018), Open Praxis (2024), the Kestin et al. 2025 Harvard and Stanford Tutor CoPilot AI-tutor RCTs; and the peer-reviewed learning-science literature cited across `docs/deep/01–04`, `docs/foundations/01–04`, and `docs/landscape/01–07`. Analysis files: `analysis/landscape/build_access.py`, `build_expansion.py`, `build_geographic.py`, `build_historical.py`, `results.json`, `results_expansion.json`, `results_geographic.json`, `results_historical.json`, and the figures in `analysis/landscape/figures/` (the nine base + expansion figures plus `fig_access_arc.png`, `fig_literacy_longrun.png`, `fig_geo_.png, and figmodalityreach.png). Every headline number is traceable to one of these. Reproduce: python3 scripts/buildall.py` then `python3 scripts/findings.py`; the landscape analyses regenerate via `cd analysis/landscape && python3 buildaccess.py && python3 buildexpansion.py && python3 buildgeographic.py && python3 buildhistorical.py && python3 makefigures.py && python3 makefiguresexpansion.py && python3 makefiguresgeographic.py && python3 makefigureshistorical.py && python3 makefiguresmodality.py`.*