03 — Expanding the Knowledge-Access Map: Cost, Field, Time, Continuity, Latency
Five new dimensions over the same Age × Knowledge-depth grid
education-atlas landscape analysis. Generated by `analysis/landscape/buildexpansion.py → resultsexpansion.json`; figures by `makefiguresexpansion.py`; headline numbers pinned by `testexpansion.py. It **reuses** the L0–L5 depth ladder and age bins from scale.py and the same access surface from buildaccess.py` (docs `01`/`02`), so the expansion is consistent with the base map rather than a parallel re-derivation. Every modeled cell is flagged real / anchor / estimated below.
0. What this adds
Docs 01 (solution landscape) and 02 (access measurement) built the base map: who reaches each knowledge depth, by income, and where solutions cluster. This brief expands the map along the five dimensions it did not yet build, each with a real graph:
| # | Dimension | Question | Figure |
|---|---|---|---|
| 1 | Cost-to-access | What does it cost to reach each depth? | fig_cost_surface.png |
| 2 | Field / breadth (3rd axis) | Is depth served evenly across disciplines? | fig_depth_field.png |
| 3 | Temporal trend | Has frontier access risen over time? | fig_temporal_trend.png |
| 4 | Continuity / pipeline-leak | Of 100 at L0, how many survive to L5? | fig_continuity_funnel.png |
| 5 | Latency / gatekeepers | How many gates between a learner and L4/L5? | fig_gatekeepers.png |
The depth ladder is unchanged: L0 literacy · L1 K-12 · L2 undergrad · L3 graduate/professional · L4 frontier (read primary research) · L5 producing new knowledge. Age bins: 0-5 · 5-18 · 18-22 · 22-65 · 65+.
1. Dimension 1 — Cost-to-access per depth
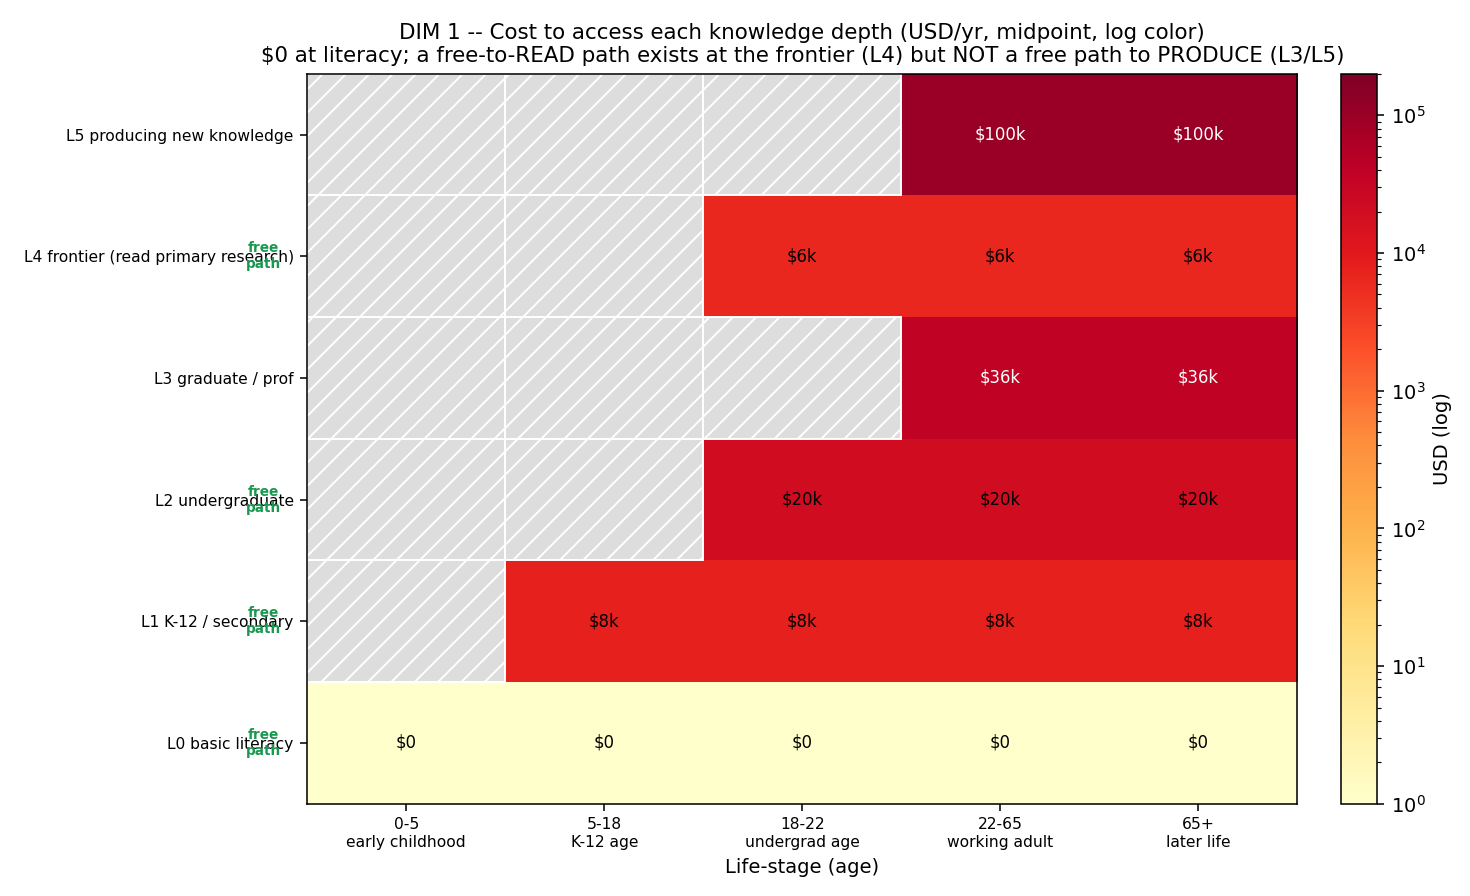
analysis/landscape/figures/fig_cost_surface.png
A USD cost surface over age × depth (midpoint of a cited low/high range, log-colored, gated by the same structural reachability mask as the access surface). The cost to reach and operate at each rung, per person-year:
| Depth | Cheapest legit path | Typical paid path | Free $0 path exists? |
|---|---|---|---|
| L0 literacy | $0 (public primary, Wikipedia, free apps) | $0 | Yes |
| L1 K-12 | $0 (public secondary, OER) | ~$15k/yr (US private K-12) | Yes |
| L2 undergrad | $0 (free-tuition systems, MIT OCW, OpenStax) | ~$40k/yr (US private; ~$11k public in-state) | Yes (content; not credential) |
| L3 grad/prof | ~$12k/yr (public grad) | ~$60k/yr (US law/med/MBA) | No |
| L4 frontier | $35–50 per paywalled article; $0 to read OA (arXiv/PMC/PLOS/Unpaywall) | APC ~$2k avg, Nature 2026 = $12,850 | Yes — to READ |
| L5 produce | — | ~$50k–150k/yr (one funded researcher-year direct cost) | No |
Headline (cost): The cost curve is bimodal, not monotone. Reaching the floor (L0–L2) and reading the frontier (L4) both have a genuine $0 path — public schooling, OER, and open access. But there is *no free path to produce knowledge: L3 (graduate credential) starts at ~$12k/yr and L5 (doing research) costs ~$50k–150k per researcher-year, the most expensive rung on the grid. The economic cliff is not "the frontier is expensive to read" — that's increasingly free — it is "producing knowledge has no free on-ramp." The single sharpest paywall number: Nature's 2026 APC is $12,850 to publish one open-access article.*
Real vs estimated: USD anchors are REAL cited 2024–2026 figures (Nature APC $12,850 per STAT 2026; US tuition per College Board; per-article paywalls per publisher sites; researcher-year direct cost). The age×depth midpoint surface is a derived summary (real anchors, estimated midpoint), and the figures are US/OECD-leaning — the shape (free floor, no free production path) holds globally, the exact dollars do not.
2. Dimension 2 — The 3rd axis: depth × FIELD
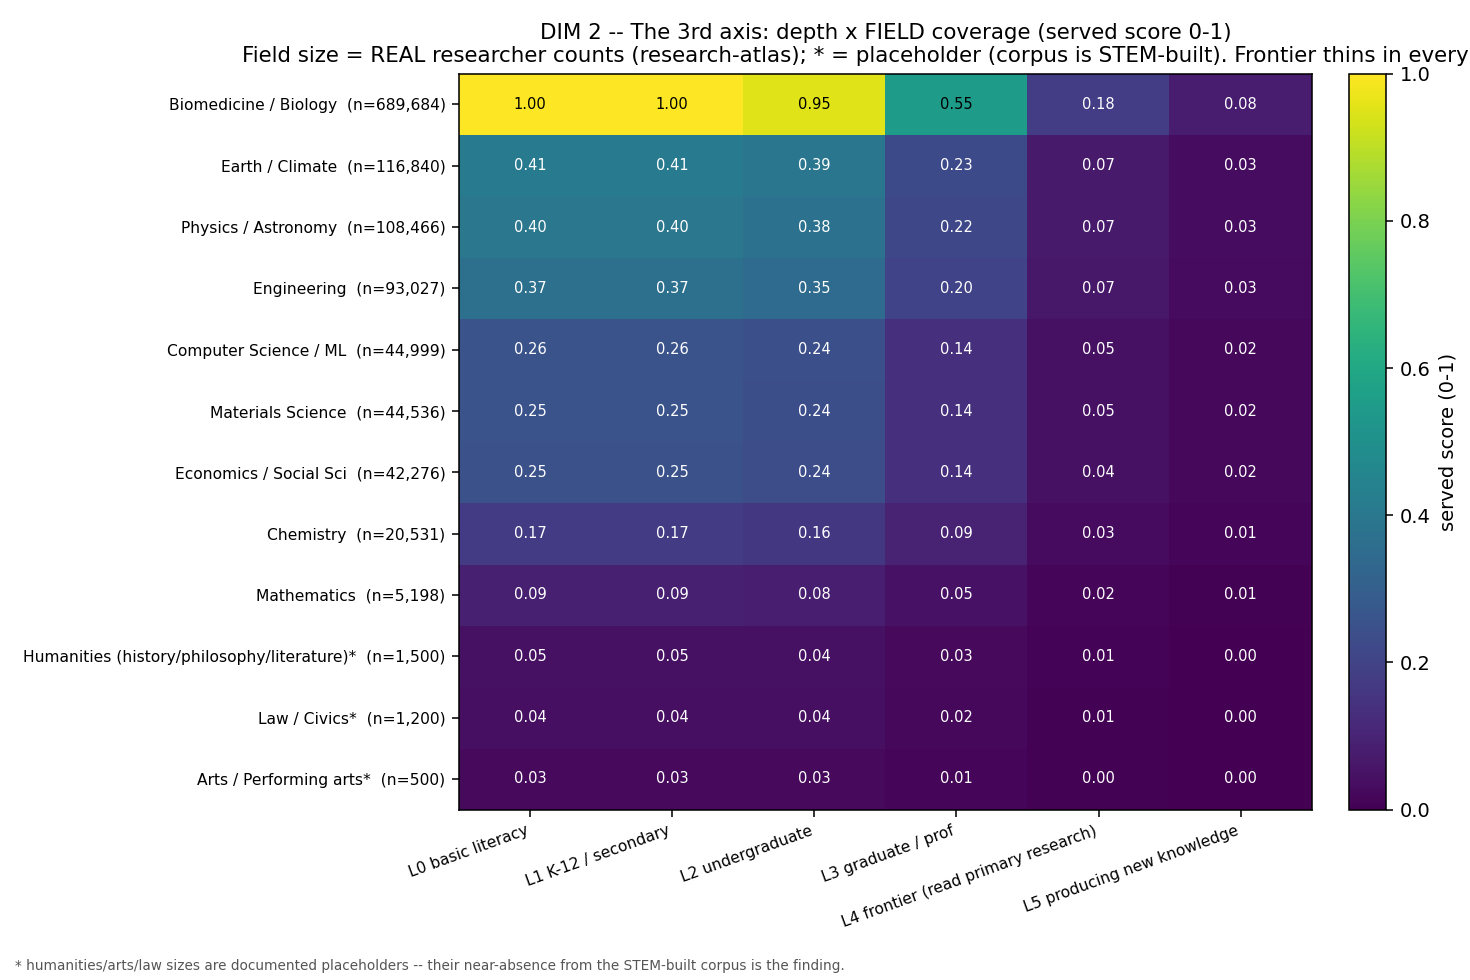
analysis/landscape/figures/fig_depth_field.png
Coverage is not uniform across disciplines. Using the research-atlas researcher-per-field counts (real) as field-size, the served-score (0–1) heatmap shows two gradients at once: rich-vs-thin across fields, and the universal frontier cliff within every field.
Real field sizes (researchers in the corpus):
| Field | Researchers | Real? |
|---|---|---|
| Biomedicine / Biology | 689,684 | real |
| Earth / Climate | 116,840 | real |
| Physics / Astronomy | 108,466 | real |
| Engineering | 93,027 | real |
| Computer Science / ML | 44,999 | real |
| Materials Science | 44,536 | real |
| Economics / Social Sci | 42,276 | real |
| Chemistry | 20,531 | real |
| Mathematics | 5,198 | real |
| Humanities (hist/phil/lit) | 1,500 | placeholder |
| Law / Civics | 1,200 | placeholder |
| Arts / Performing arts | 500 | placeholder |
Headline (field): Depth coverage is wildly uneven across fields. Biomedicine has ~133× more researchers than mathematics (689,684 vs 5,198) and ~460× more than the arts placeholder. Even within well-served STEM, the frontier thins everywhere — L4 served-score is below L2 in every single field. And the humanities/arts/law are structurally absent from the STEM-built research corpus entirely: their near-zero presence is not a data gap to apologize for, it is the finding — the frontier-access infrastructure (preprints, discovery, AI research tools) is overwhelmingly built for biomedical and physical science, leaving the humanities frontier the thinnest cell of all.
Real vs estimated: field sizes for the 9 STEM/social fields are REAL (research-atlas researcher_segment). Humanities/arts/law sizes are documented placeholders (the corpus does not index them; their near-absence is the point). The served-score = field-size⁰·⁵ × a per-depth attenuation (estimated, shaped on the base-map frontier cliff).
3. Dimension 3 — Temporal trend: is access democratizing?
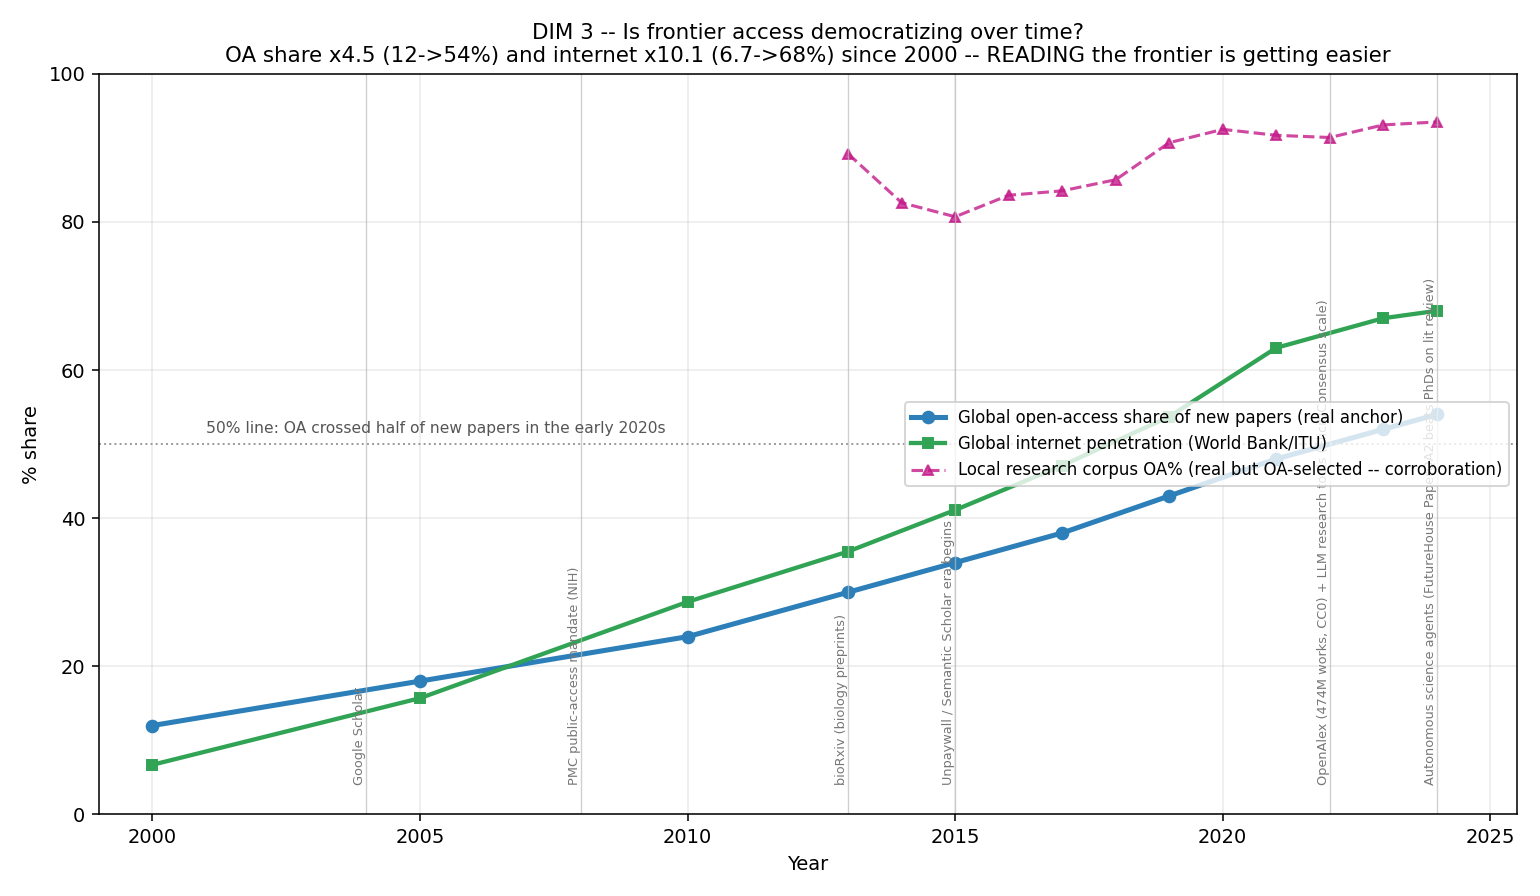
analysis/landscape/figures/fig_temporal_trend.png
Three real series plus tool-arrival milestones, 2000→2024:
| Series | 2000 | 2024 | Change |
|---|---|---|---|
| Global OA share of new papers | 12% | 54% | ×4.5 |
| Global internet penetration | 6.7% | 68% | ×10.1 |
| Local corpus OA% (biased high) | — | ~93% | corroboration |
Milestones layered on the timeline: arXiv (1991), Google Scholar (2004), PMC mandate (2008), bioRxiv (2013), Unpaywall/Semantic Scholar (2015), OpenAlex + scaled LLM research tools (2022), autonomous science agents (2024).
Headline (temporal): Reading the frontier is genuinely democratizing — producing it is not. Open-access share of new papers quadrupled (12%→54%) and crossed the 50% line in the early 2020s, while internet penetration grew ~10× (6.7%→68%) and a stack of free discovery + AI tools arrived. The read-access cliff from doc 02 is eroding fast. But this trend touches L4 (reading) only — it does not move the L4→L5 frontier-production rate, which doc 02 pins at ~0.136% of humanity and which has no comparable democratizing curve. *The honest answer: access to consume the frontier is democratizing; access to produce it is persistent.*
Real vs estimated: global OA-by-year and internet-by-year are REAL anchors (published OA bibliometrics — OpenAlex/Unpaywall/Curtin COKI; World Bank/ITU IT.NET.USER.ZS). Tool milestones are real dates. The local corpus OA series is real but OA-selected (it sits ~90%+ because the corpus is built from OA-discoverable works) — used only as directional corroboration, never as the headline.
4. Dimension 4 — Continuity / the pipeline leak
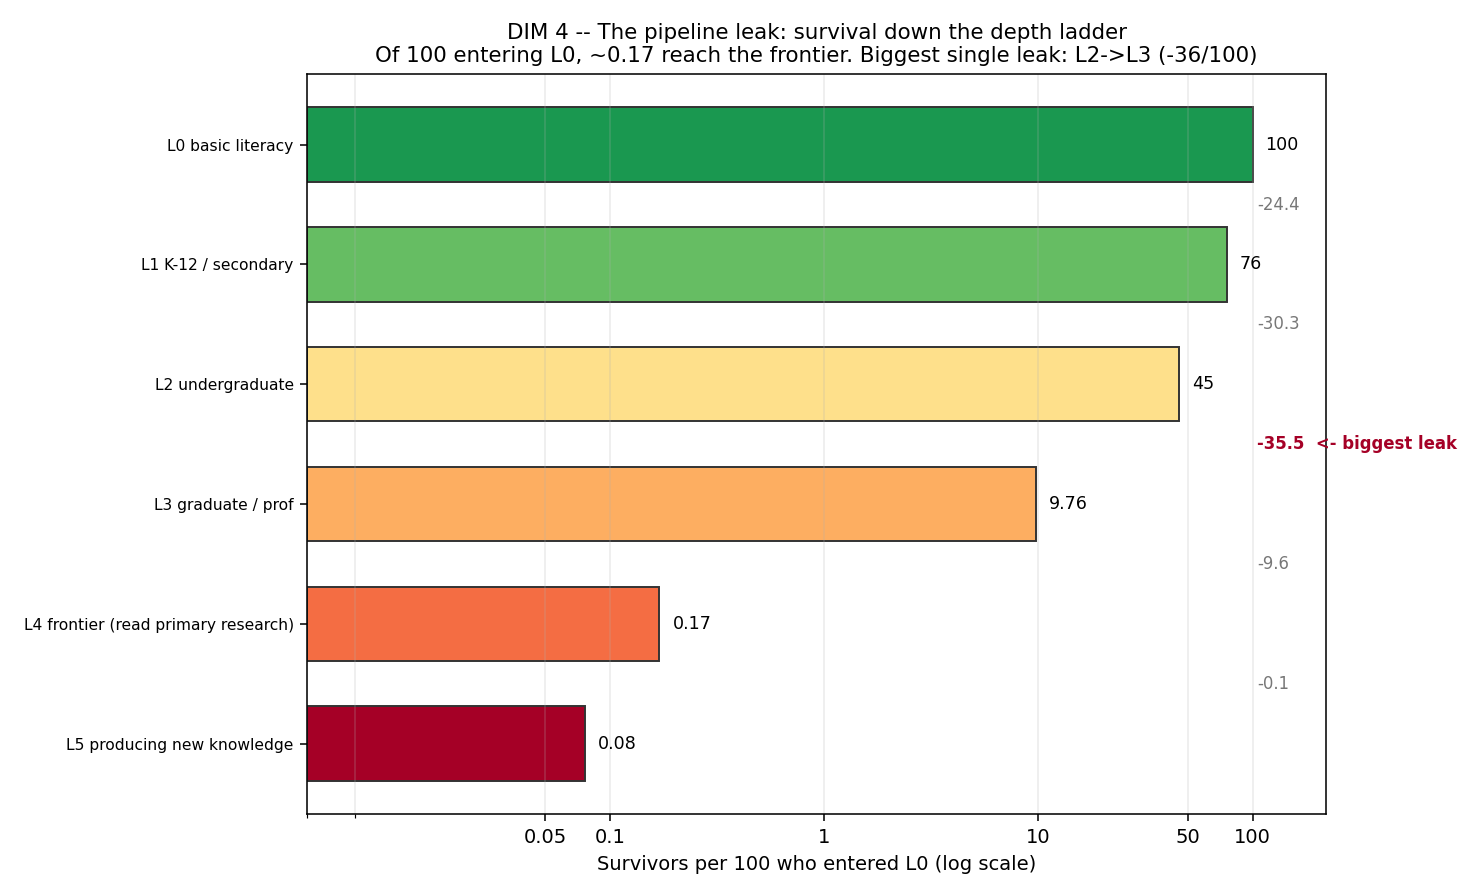
analysis/landscape/figures/fig_continuity_funnel.png
Of 100 people present at L0, how many survive to each deeper rung (the base-map world-average access normalized to the L0 cohort):
| Depth | Survivors per 100 at L0 | Drop from previous |
|---|---|---|
| L0 literacy | 100.0 | — |
| L1 K-12 | 75.6 | −24.4 |
| L2 undergrad | 45.3 | −30.3 |
| L3 grad/prof | 9.76 | −35.5 ← biggest leak |
| L4 frontier | 0.17 | −9.6 |
| L5 produce | 0.077 | −0.09 |
Headline (continuity): The biggest single leak is L2→L3 — the undergrad-to-graduate gap — which loses ~36 of every 100 who entered L0. Of 100 people, ~76 reach secondary, ~45 reach undergrad, but only ~9.8 reach graduate depth, ~0.17 reach the frontier, and ~0.08 ever produce new knowledge. The leak is not at the bottom (literacy retains 76%) — it is the middle-to-upper transitions: the established-to-graduate step (L2→L3) and the graduate-to-frontier step (L3→L4, conditional advance ~1.7%) are where the pipeline empties out. This is the quantified version of doc 01's "the L3→L4 bridge is unbuilt."
Real vs estimated: survival is the base-map world_access (REAL L0–L2, anchored L3–L5) normalized to the L0 cohort. It is a survival/presence curve, not a measured longitudinal transition — it shows how many of a representative population sit at each depth, not tracked individuals over time.
5. Dimension 5 — Latency to frontier / gatekeeper count
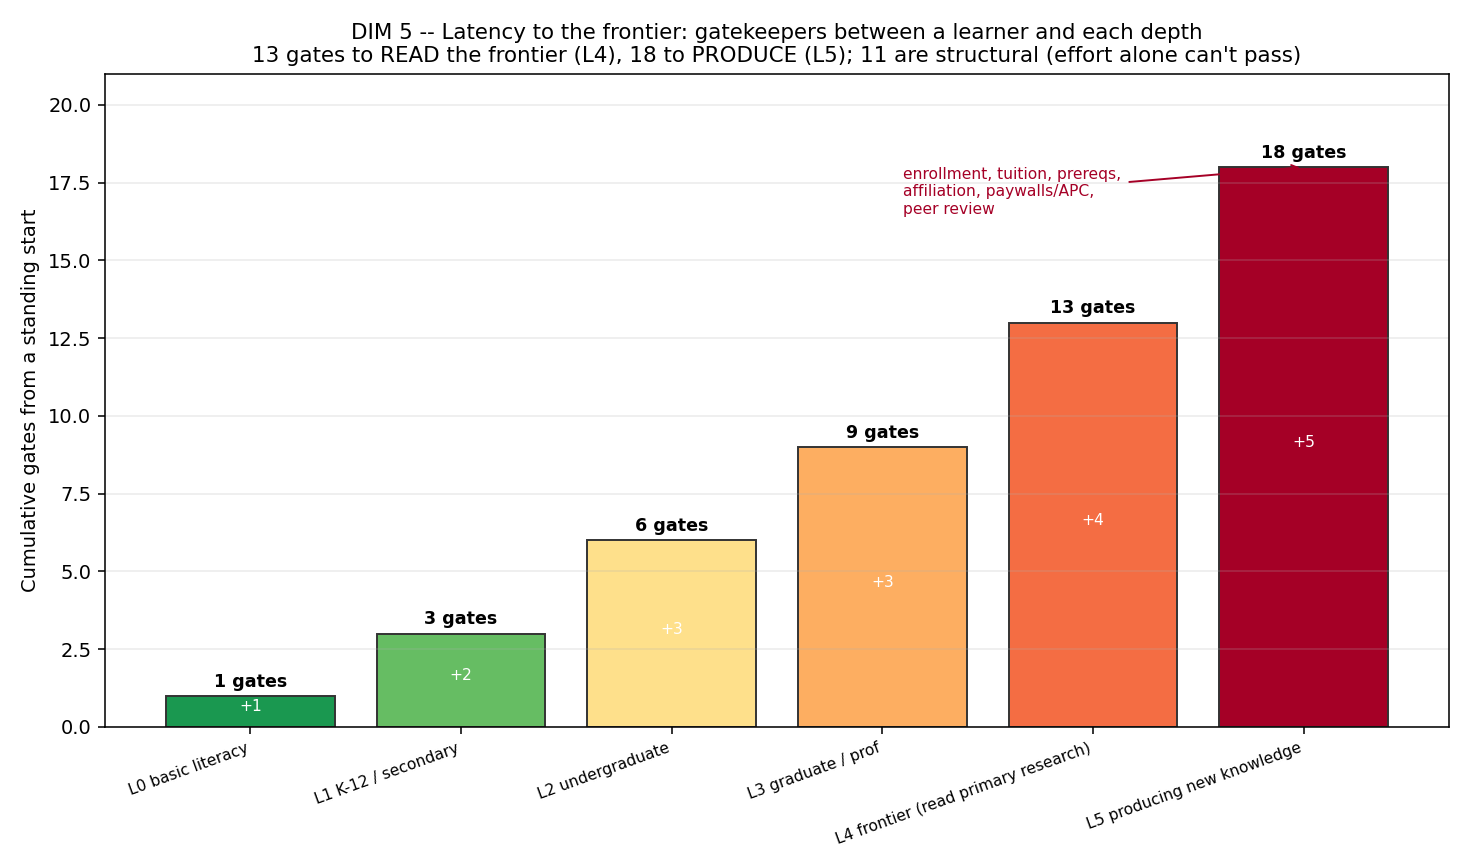
analysis/landscape/figures/fig_gatekeepers.png
A structured enumeration of the discrete gates between a motivated learner and each depth (cumulative, from a standing start):
| Depth | Gates added | Cumulative | Example new gate |
|---|---|---|---|
| L0 | 1 | 1 | literacy instruction |
| L1 | 2 | 3 | enrollment + years of attendance |
| L2 | 3 | 6 | diploma + admission + tuition |
| L3 | 3 | 9 | bachelor's + grad admission + grad tuition |
| L4 | 4 | 13 | grad training + institutional affiliation + paywall/APC + domain fluency |
| L5 | 5 | 18 | research position + funding + ethics approval + peer review + APC up to $12,850 |
Headline (latency): A learner must clear *13 gates to read the frontier (L4) and 18 to produce (L5) — and 11 of the 18 are structural gates that effort alone cannot pass: tuition, admissions, institutional affiliation, paywalls/APCs, a funded research position, ethics approval, and peer-review acceptance. The latency to the frontier is not mainly a knowledge barrier (which open access + AI tools now lower); it is a stack of institutional and financial gates*, and they concentrate at exactly the L3→L4→L5 transitions where doc 04's pipeline leak is worst.
Real vs estimated: the gate inventory is a structured enumeration of real, named barriers (enrollment, tuition, prerequisites, affiliation, paywall/APC, peer review). Counts are exact for the enumerated list; the list is representative, not exhaustive.
6. What's real vs estimated (the honesty ledger)
| Dimension | Status | Anchor / assumption |
|---|---|---|
| Cost — USD per depth | REAL anchors | Nature APC $12,850 (STAT 2026), College Board tuition, publisher paywalls, researcher-year cost |
| Cost — age×depth midpoint surface | derived | midpoint of real low/high; US/OECD-leaning |
| Field sizes (9 STEM fields) | REAL | research-atlas researcher_segment |
| Field sizes (humanities/arts/law) | PLACEHOLDER | corpus is STEM-built; near-absence is the finding |
| Field served-score | estimated | size⁰·⁵ × per-depth attenuation shaped on base cliff |
| Global OA share by year | REAL anchor | OA bibliometrics (OpenAlex/Unpaywall/COKI) |
| Internet penetration by year | REAL anchor | World Bank / ITU IT.NET.USER.ZS |
| Tool milestones | REAL dates | arXiv→FutureHouse timeline |
| Local corpus OA% by year | REAL but biased | corpus OA-selected; corroboration only |
| Continuity funnel | REAL (L0–L2) + anchored (L3–L5) | base-map world_access normalized; presence not longitudinal |
| Gatekeeper inventory | structured enumeration | real named barriers; counts exact for the list |
| Depth ladder L0–L5, age bins | CONSTRUCTED | reused from scale.py |
Known limitations. (1) Costs are US/OECD-leaning; the shape generalizes, the dollars do not. (2) The field corpus is STEM/biomed-built, so the humanities frontier is under-counted (the placeholder makes the gap visible but is not a measured census). (3) The continuity funnel is a cross-sectional survival curve, not tracked individuals. (4) The gate list is representative, not exhaustive. (5) The OA temporal trend measures reading access only — it does not democratize production.
7. The expansion headline
*The base map said depth is the binding constraint and income buys it. The expansion says the binding constraint is production, not consumption. Reaching the floor and reading the frontier both now have a $0 path and are democratizing over time (OA ×4.5 to 54%, internet ×10 to 68%). But producing knowledge has no free path (L5 ~$50–150k/researcher-year), is wildly uneven across fields (biomed has 133× more researchers than math, humanities barely exist in the frontier infrastructure), leaks worst at the L2→L3 step (−36 of every 100), and sits behind 18 gates, 11 of them structural* (affiliation, tuition, paywalls/APCs up to $12,850, peer review). Consuming the frontier is getting free and easy; producing it remains gated, expensive, and STEM-concentrated.
8. Reproduce
cd analysis/landscape
python3 build_expansion.py            # -> results_expansion.json
python3 make_figures_expansion.py     # -> figures/fig_{cost_surface,depth_field,temporal_trend,continuity_funnel,gatekeepers}.png
python3 -m pytest test_expansion.py -q # pins the new headline numbers
python3 -m pytest -q                   # full suite (existing + expansion) stays green
Files: analysis/landscape/scale.py (constructed axes, reused), build_access.py (base surface, reused), build_expansion.py (this analysis), make_figures_expansion.py (the 5 figures), results_expansion.json (output), test_expansion.py (regression guard). Sibling docs: 01-solution-landscape.md, 02-access-data-science.md.