02 — Quantifying Knowledge Access on the Age × Knowledge-Depth Grid
A data-science measurement of who can reach how deep into knowledge, and where the access cliff is
education-atlas landscape analysis. Generated by `analysis/landscape/buildaccess.py → results.json; figures by makefigures.py`; headline numbers pinned by `testaccess.py`. Real anchors are World Bank EdStats (enrollment, literacy), UNESCO UIS (researchers-per-million), ITU (internet by age), and the research-atlas corpus. Constructed scales and every modeled cell are flagged explicitly below._
0. The question
Education debates usually measure enrollment — are children in a classroom? This analysis asks a harder question: for a person of a given age, how deep into a body of knowledge can they actually go? And the inverse: what fraction of humanity ever reaches the frontier — the place where new knowledge is read, let alone produced?
We lay the question on a grid:
- X = Age / life-stage:
0-5·5-18·18-22·22-65·65+ - Y = Knowledge depth: a constructed 6-rung ladder
- L0 basic literacy / numeracy
- L1 K-12 / secondary
- L2 undergraduate
- L3 graduate / professional
- L4 frontier — reading primary research
- L5 producing new knowledge
The deliverable is a measured surface over that grid, split by income tier, overlaid with solution density, and reduced to four headline findings.
1. The constructed scale (read this before trusting any cell)
The two axes are not measured by any authoritative body — they are an analytical frame this project defines in analysis/landscape/scale.py. What is real is the access proxy mapped to each rung:
| Depth | Meaning | ISCED | Access proxy | Real / Estimated |
|---|---|---|---|---|
| L0 | basic literacy/numeracy | — | Adult literacy rate (SE.ADT.LITR.ZS) | Real (World Bank) |
| L1 | K-12 / secondary | 1–3 | Secondary net enrollment (SE.SEC.NENR) | Real (World Bank) |
| L2 | undergraduate | 6 | Tertiary gross enrollment (SE.TER.ENRR) | Real (World Bank) |
| L3 | graduate / professional | 7–8 | Tertiary GER × graduate-entry share | Real base × estimated multiplier |
| L4 | frontier (read primary research) | — | Researchers per million (SP.POP.SCIE.RD.P6) | Real anchor (UNESCO UIS) |
| L5 | producing new knowledge | — | L4 × active-publishing share | Real anchor × estimated multiplier |
A second constructed object is the age×depth structural mask (AGE_DEPTH_OPEN): you cannot be at undergraduate depth at age 3, so cells outside a level's reachable life-stage are marked structurally N/A (greyed, not zero). This is a modeling decision, documented in code.
Why split L4 and L5. L4 = reaching the frontier (being a researcher, able to read primary literature). L5 = adding to it (publishing). The data shows them as almost the same sliver — which is itself the finding.
2. Method
- Real surface (L0–L2). For each World Bank indicator, take the
latest-available value per country, then the mean within each income group (High / Upper-mid / Lower-mid / Low). Pure measurement, no modeling. (build_access.load_income_surface)
- L3 (graduate). Multiply the real tertiary GER by a documented
graduate-entry share per tier (0.30 HIC → 0.06 LIC), anchored on OECD Education at a Glance graduate-entry rates. Real base × estimated factor.
- L4 (frontier). Take UNESCO UIS researchers per million inhabitants by
income group (documented group means), divide by 1e6, ×100 → a % of population. Real anchor.
- L5 (production). L4 ×
0.45(share of researchers who actively publish).
Estimated multiplier on the real L4 anchor.
- World-average row. Unweighted mean of the four tiers (chosen for
transparency over a population weighting whose weights would themselves be modeled).
- Solution density. Read
data/landscape/solutions.csvif the sibling
solution-landscape exists; otherwise use a documented density prior that encodes the known EdTech market shape (dense at K-12 / consumer-undergrad, sparse at the frontier). Flagged as estimated when the CSV is absent.
- Corroboration. The research-atlas slim DB supplies the real global
researcher population as an independent cross-check on the frontier slice.
Everything is deterministic and idempotent: re-running reproduces results.json byte-for-byte from the same inputs.
3. The four findings (with graphs)
Finding 1 — The access cliff is down the depth axis, not across age
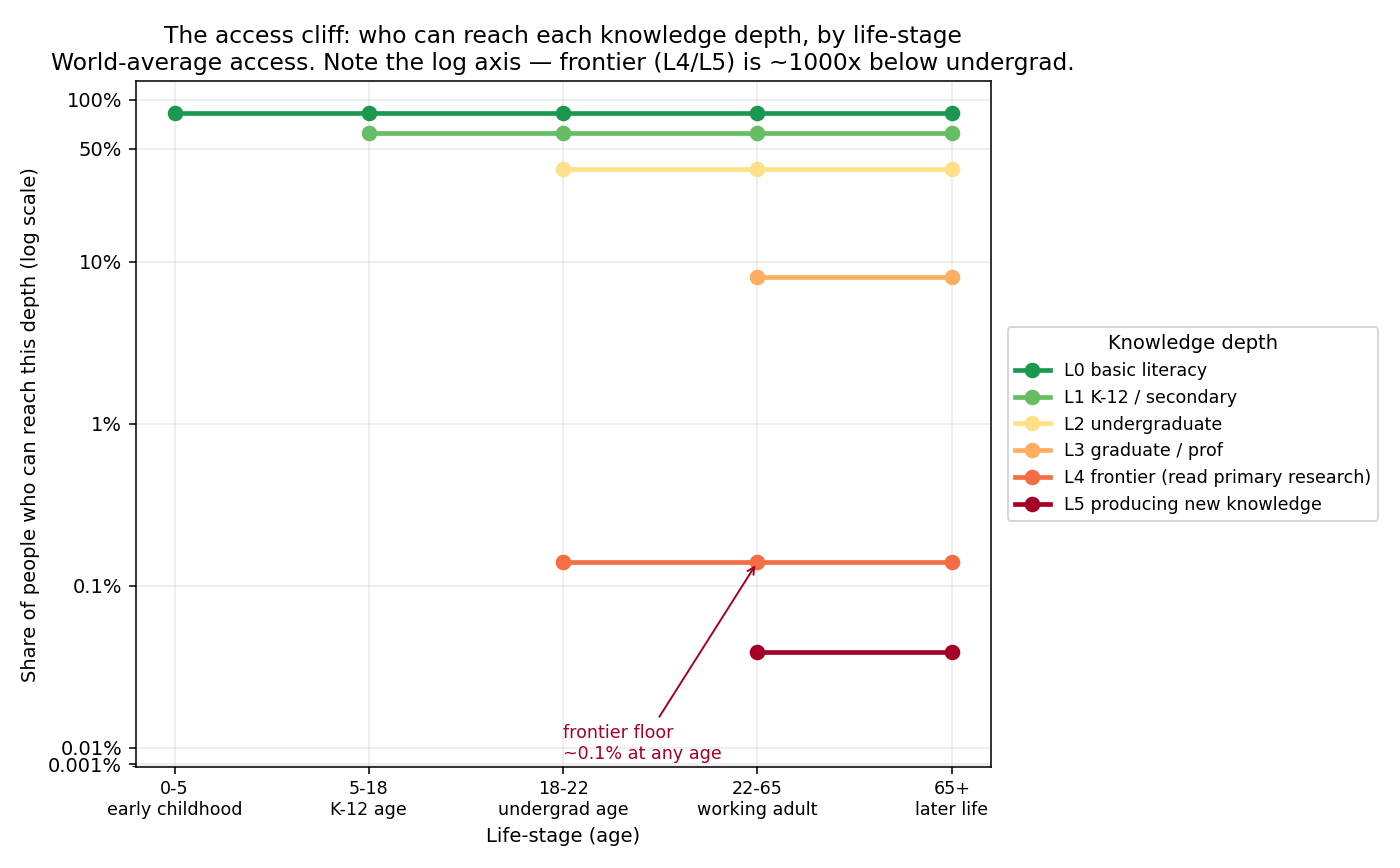
analysis/landscape/figures/fig_access_vs_age.png
World-average access by depth (real for L0–L2):
| Depth | World access |
|---|---|
| L0 basic literacy | 82.5% |
| L1 K-12 / secondary | 62.4% |
| L2 undergraduate | 37.4% |
| L3 graduate / professional | 8.1% (est) |
| L4 frontier | 0.14% (real anchor) |
| L5 producing new knowledge | 0.06% (est) |
The y-axis is logarithmic because the drop is otherwise invisible: from undergraduate (37%) to frontier (0.14%) is a ~270× fall. Within a life-stage, access barely changes with age (lifelong access keeps the lines flat); the cliff is the vertical distance between rungs. Depth, not age, is the binding constraint.
Finding 2 — The equity gradient: income decides depth
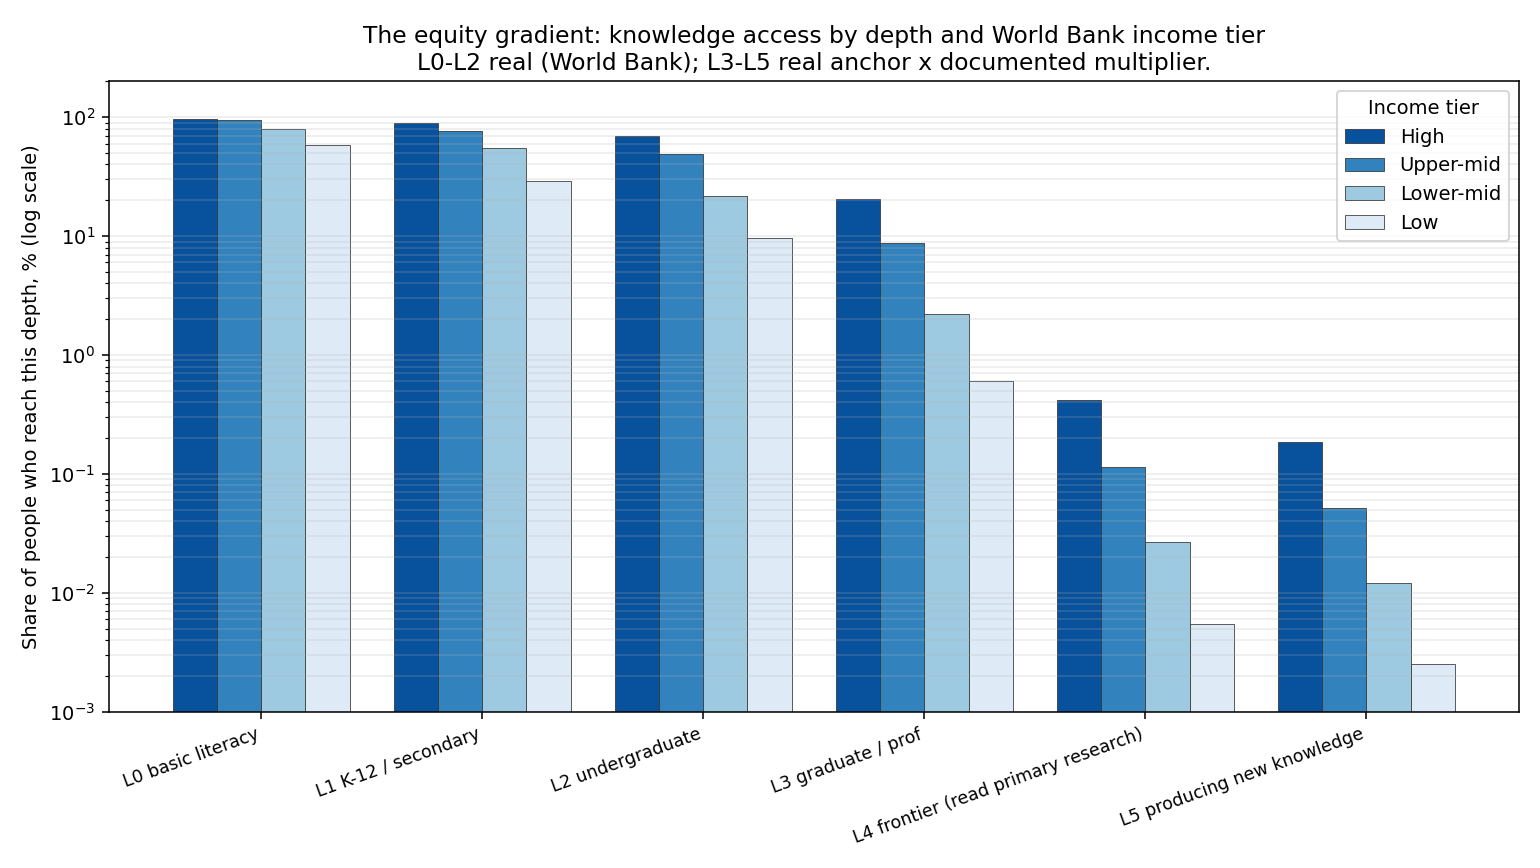
analysis/landscape/figures/fig_income_surface.png
Real World Bank values, latest per country, by income tier:
| Depth | High | Upper-mid | Lower-mid | Low | HIC÷LIC |
|---|---|---|---|---|---|
| L0 literacy | 97.2% | 94.4% | 79.7% | 58.7% | 1.7× |
| L1 secondary | 88.8% | 76.8% | 54.7% | 29.2% | 3.0× |
| L2 undergrad | 68.8% | 49.1% | 21.9% | 9.7% | 7.1× |
| L3 graduate (est) | 20.6% | 8.8% | 2.2% | 0.6% | ~34× |
| L4 frontier (real) | 0.42% | 0.12% | 0.027% | 0.0055% | ~75× |
The gradient widens with depth. At L0 the rich-poor gap is under 2×; by the frontier it is ~75×. Tertiary access (L2) alone runs 80% in high-income vs single digits in low-income systems — the textbook equity gap, confirmed in this dataset at 68.8% vs 9.7%. (Learning poverty corroborates from the other direction: 14.2% HIC vs 89.8% LIC — nine in ten low-income children can't read at 10, so the L0 line is itself optimistic about real depth.)
Finding 3 — Coverage white-space: the top-right is empty
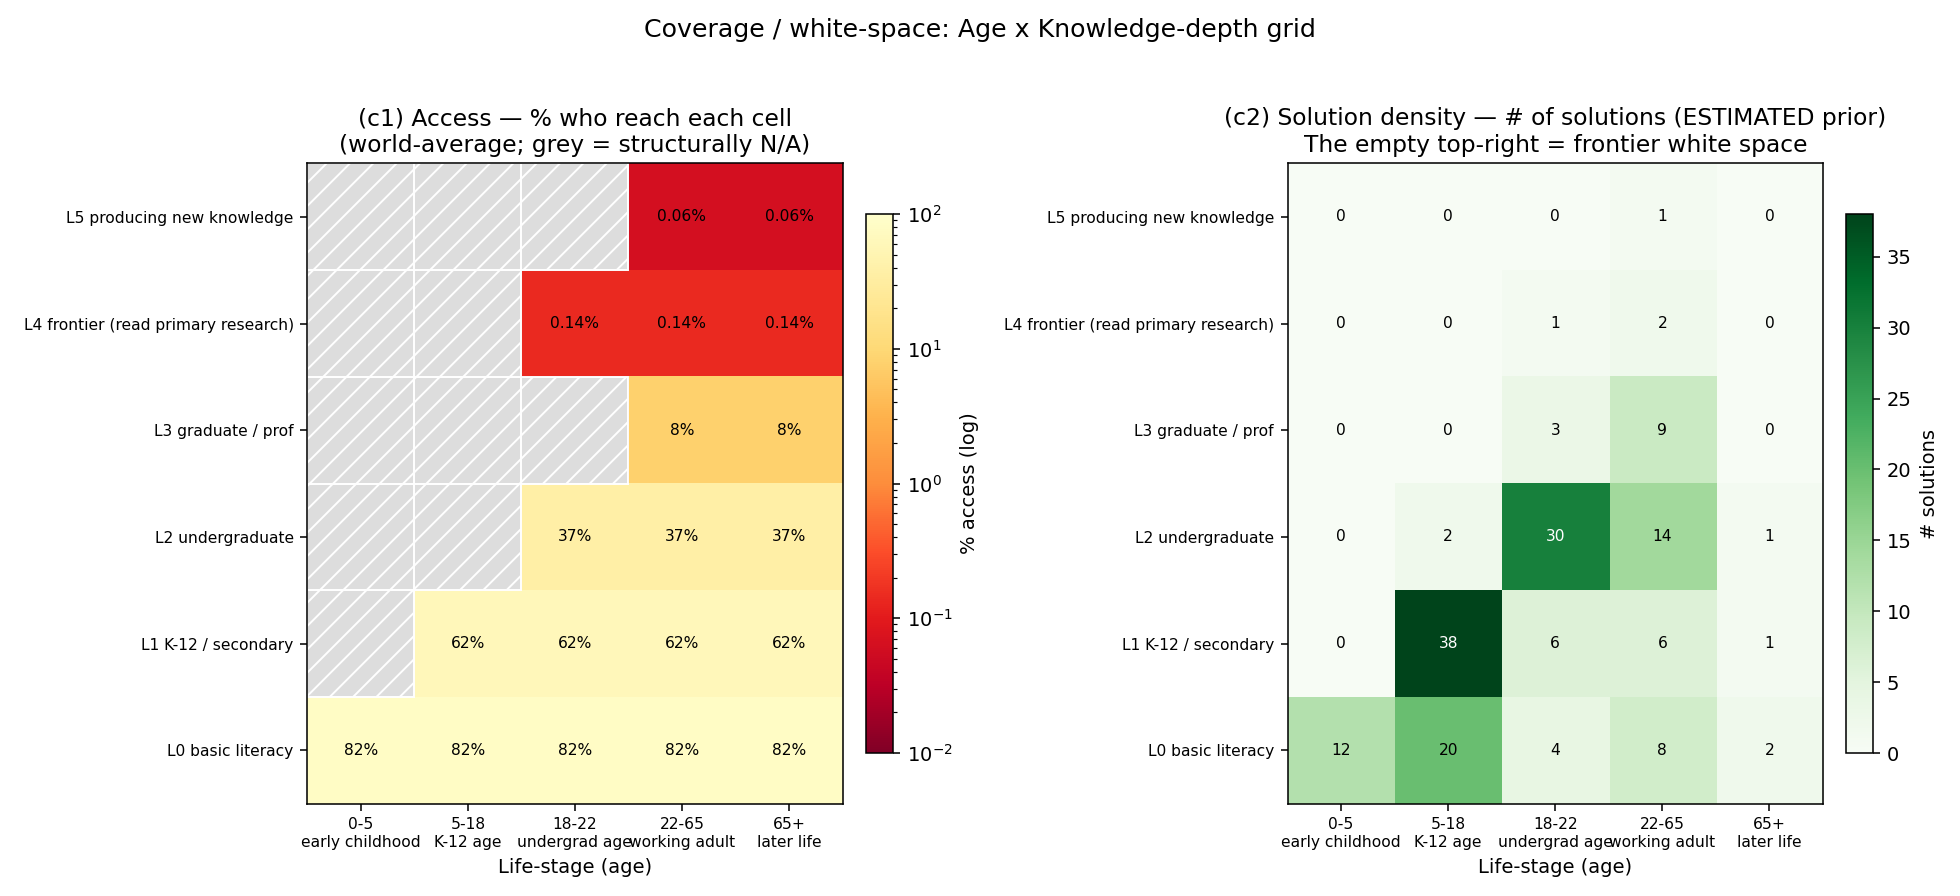
analysis/landscape/figures/fig_coverage_heatmap.png
Two panels over the same age×depth grid:
- (c1) Access — % who reach each cell (world-average; structurally-N/A cells
hatched grey). The surface is hot (high access) along the bottom and cold (≪1%) along the top two rows at every age.
- (c2) Solution density — where education solutions cluster. Dense at the
K-12 cell (L1 × 5-18) and consumer-undergrad (L2 × 18-22); the L4/L5 × working-adult corner is nearly empty.
The two panels rhyme: the cells with the worst access (frontier) also have the fewest solutions. Solution density here is a **documented estimated prior** — no `data/landscape/solutions.csv` was present at generation time; the script picks up the real CSV automatically once the sibling solution-landscape ships.
Finding 4 — Consume vs. create: ~0.1% of humanity ever produces new knowledge
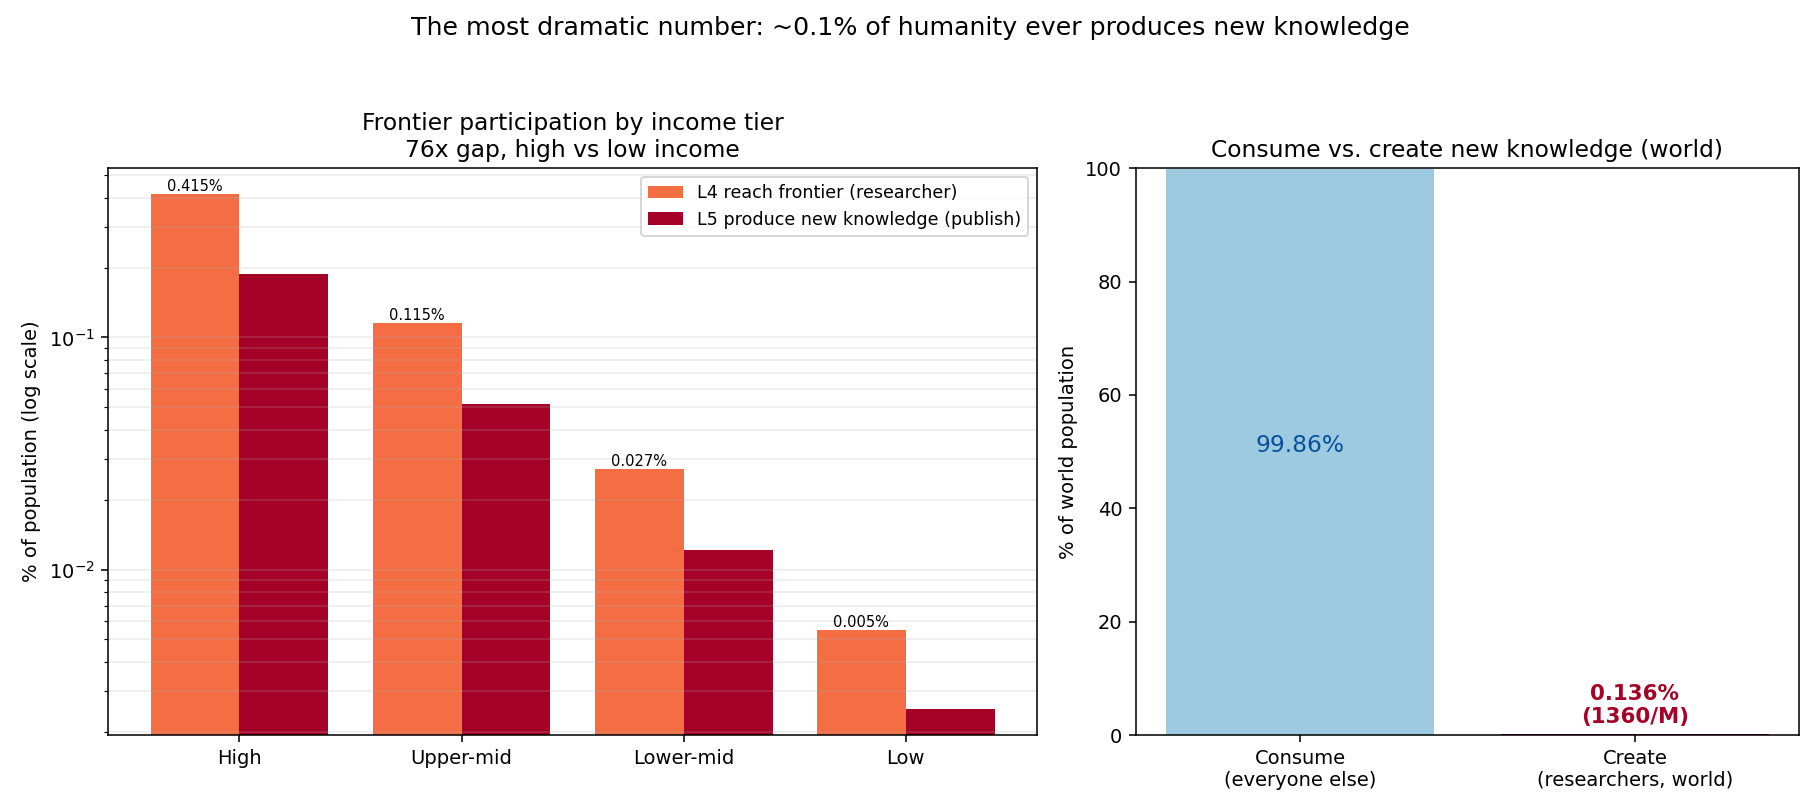
analysis/landscape/figures/fig_frontier_bar.png
The single most dramatic number in the analysis:
World researchers per million ≈ 1,360 → ~0.136% of people are at the knowledge frontier. ~99.86% only ever consume.
And it is steeply unequal: 0.42% (High income) vs 0.0055% (Low income) — a ~75× gap in who even reaches L4. L5 (actually publishing) is smaller again.
Real cross-check (research-atlas): the research corpus holds 1,438,636 distinct researchers, of whom 320,879 are currently active publishers — an independent, bottom-up confirmation that the population producing knowledge is ~10⁶, i.e. a fraction of a percent of the ~8×10⁹ humans. The two methods (UNESCO per-capita anchor and the OpenAlex corpus headcount) agree on the order of magnitude.
4. Dimension 5 — the depth ceiling of a typical person
The median depth a typical member of each tier actually reaches (highest rung with ≥50% access):
| Income tier | Depth ceiling of the median person |
|---|---|
| High income | L2 (undergraduate) |
| Upper-middle | L1 (secondary) |
| Lower-middle | L1 (secondary) |
| Low income | L0 (basic literacy) |
No income tier's typical person reaches graduate depth (L3) or beyond. Even in the richest countries, the median adult's ceiling is "some undergraduate exposure"; the frontier (L4/L5) is not a ceiling anyone's median approaches — it is reached by a sub-1% tail everywhere.
5. The access channel — internet by life-stage
Depth is gated not only by schooling but by the channel to reach it. ITU 2023 global online shares by age band (real anchor, coarse bins):
| Age | Online share |
|---|---|
| 0-5 | 0% (mediated by caregiver) |
| 5-18 | 60% |
| 18-22 | 75% |
| 22-65 | 65% |
| 65+ | 40% |
The largest age digital divide is at 65+ — exactly the life-stage with the most time for lifelong, self-directed depth. The channel narrows where the opportunity is widest.
6. What's real vs. estimated (the honesty ledger)
| Component | Status | Anchor / assumption |
|---|---|---|
| L0 / L1 / L2 access, all tiers | REAL | World Bank EdStats, latest per country |
| Learning poverty, enrollment context | REAL | World Bank EdStats |
| Researchers per million (L4) | REAL anchor | UNESCO UIS SP.POP.SCIE.RD.P6 group means |
| Researcher corpus headcount | REAL | research-atlas research_atlas_slim.duckdb |
| Internet by age | REAL anchor | ITU Facts & Figures 2023, coarse global bins |
| L3 graduate access | Real base × estimated | tertiary GER × OECD graduate-entry share (0.30→0.06) |
| L5 production | Real anchor × estimated | L4 × 0.45 active-publishing share |
| Solution density | ESTIMATED prior | documented EdTech market-shape prior (no CSV yet) |
| Age×depth structural mask | CONSTRUCTED | AGE_DEPTH_OPEN reachability rules |
| Depth ladder L0–L5, age bins | CONSTRUCTED | scale.py analytical frame |
Known limitations. (1) The depth ladder is an analytical construct, not an ISCED-exact mapping. (2) World-average rows are unweighted tier means, not population-weighted. (3) SP.POP.SCIE.RD.P6 group means are documented anchors, not pulled live from the cache (the education-atlas WB cache does not include the R&D series); they are conservative relative to widely-cited figures (world ~1,360/M). (4) Solution density is illustrative until the sibling solution-landscape CSV exists. (5) Data sparsity is worst exactly where access is worst — every low-income number is a lower bound (see EDUCATION_PROBLEMS.md §5).
7. Headline
Education's binding constraint is depth, not age, and it is bought by income. Access falls ~270× from undergraduate (37%) to the research frontier (0.14%); the rich-poor gap widens from under 2× at literacy to ~75× at the frontier; no income tier's typical person reaches graduate depth; and ~0.136% of humanity ever reaches the frontier where new knowledge is produced — ~99.86% only ever consume it. The age×depth grid's entire top-right corner — deep knowledge for ordinary adults — is the white space, in both access and solutions.
8. Reproduce
cd analysis/landscape
python3 build_access.py        # -> results.json
python3 make_figures.py        # -> figures/*.png
python3 -m pytest test_access.py -q   # pins the headline numbers
Files: analysis/landscape/scale.py (constructed axes), build_access.py (analysis), make_figures.py (figures), results.json (output), test_access.py (regression guard).